Email Marketing Data 2026: Data-Driven Research Report
Email marketing in 2026 stands at a pivotal transformation point, driven by artificial intelligence adoption, privacy regulations, and evolving consumer expectations.
1. Overall Email Performance Benchmarks
Global email users will reach 4.83 billion in 2025, climbing to 5.61 billion by 2030 at a 3.4% CAGR. Daily email volume projects to grow from 392 billion (2025) to 523 billion messages by 2030. Despite privacy-induced metric volatility, email marketing maintains exceptional ROI at $36-40 per dollar spent, with the industry revenue trajectory rising from $11.3 billion (2025) to $21.8 billion by 2030.
Critical 2026 trends: AI personalization adoption reaches 64% of marketers (up from 52% in 2023), delivering 41% revenue increases and 13.44% CTR improvements. Automated email flows—representing just 2% of send volume—now drive 41% of total email revenue. Mobile dominates at 55% of all opens, while deliverability faces headwinds with average inbox placement dropping to 84%. Open rates have stabilized at 26.9-42.35% following Apple Mail Privacy Protection disruptions, with forecasts predicting 31-34% through 2030.
📌 Learn more: Email Bounce Rate Benchmarks 2025–2026.
A. Historical Performance (2020-2025)
Email marketing metrics experienced significant volatility from 2020-2025, primarily driven by Apple Mail Privacy Protection (MPP) implementation and evolving privacy standards.
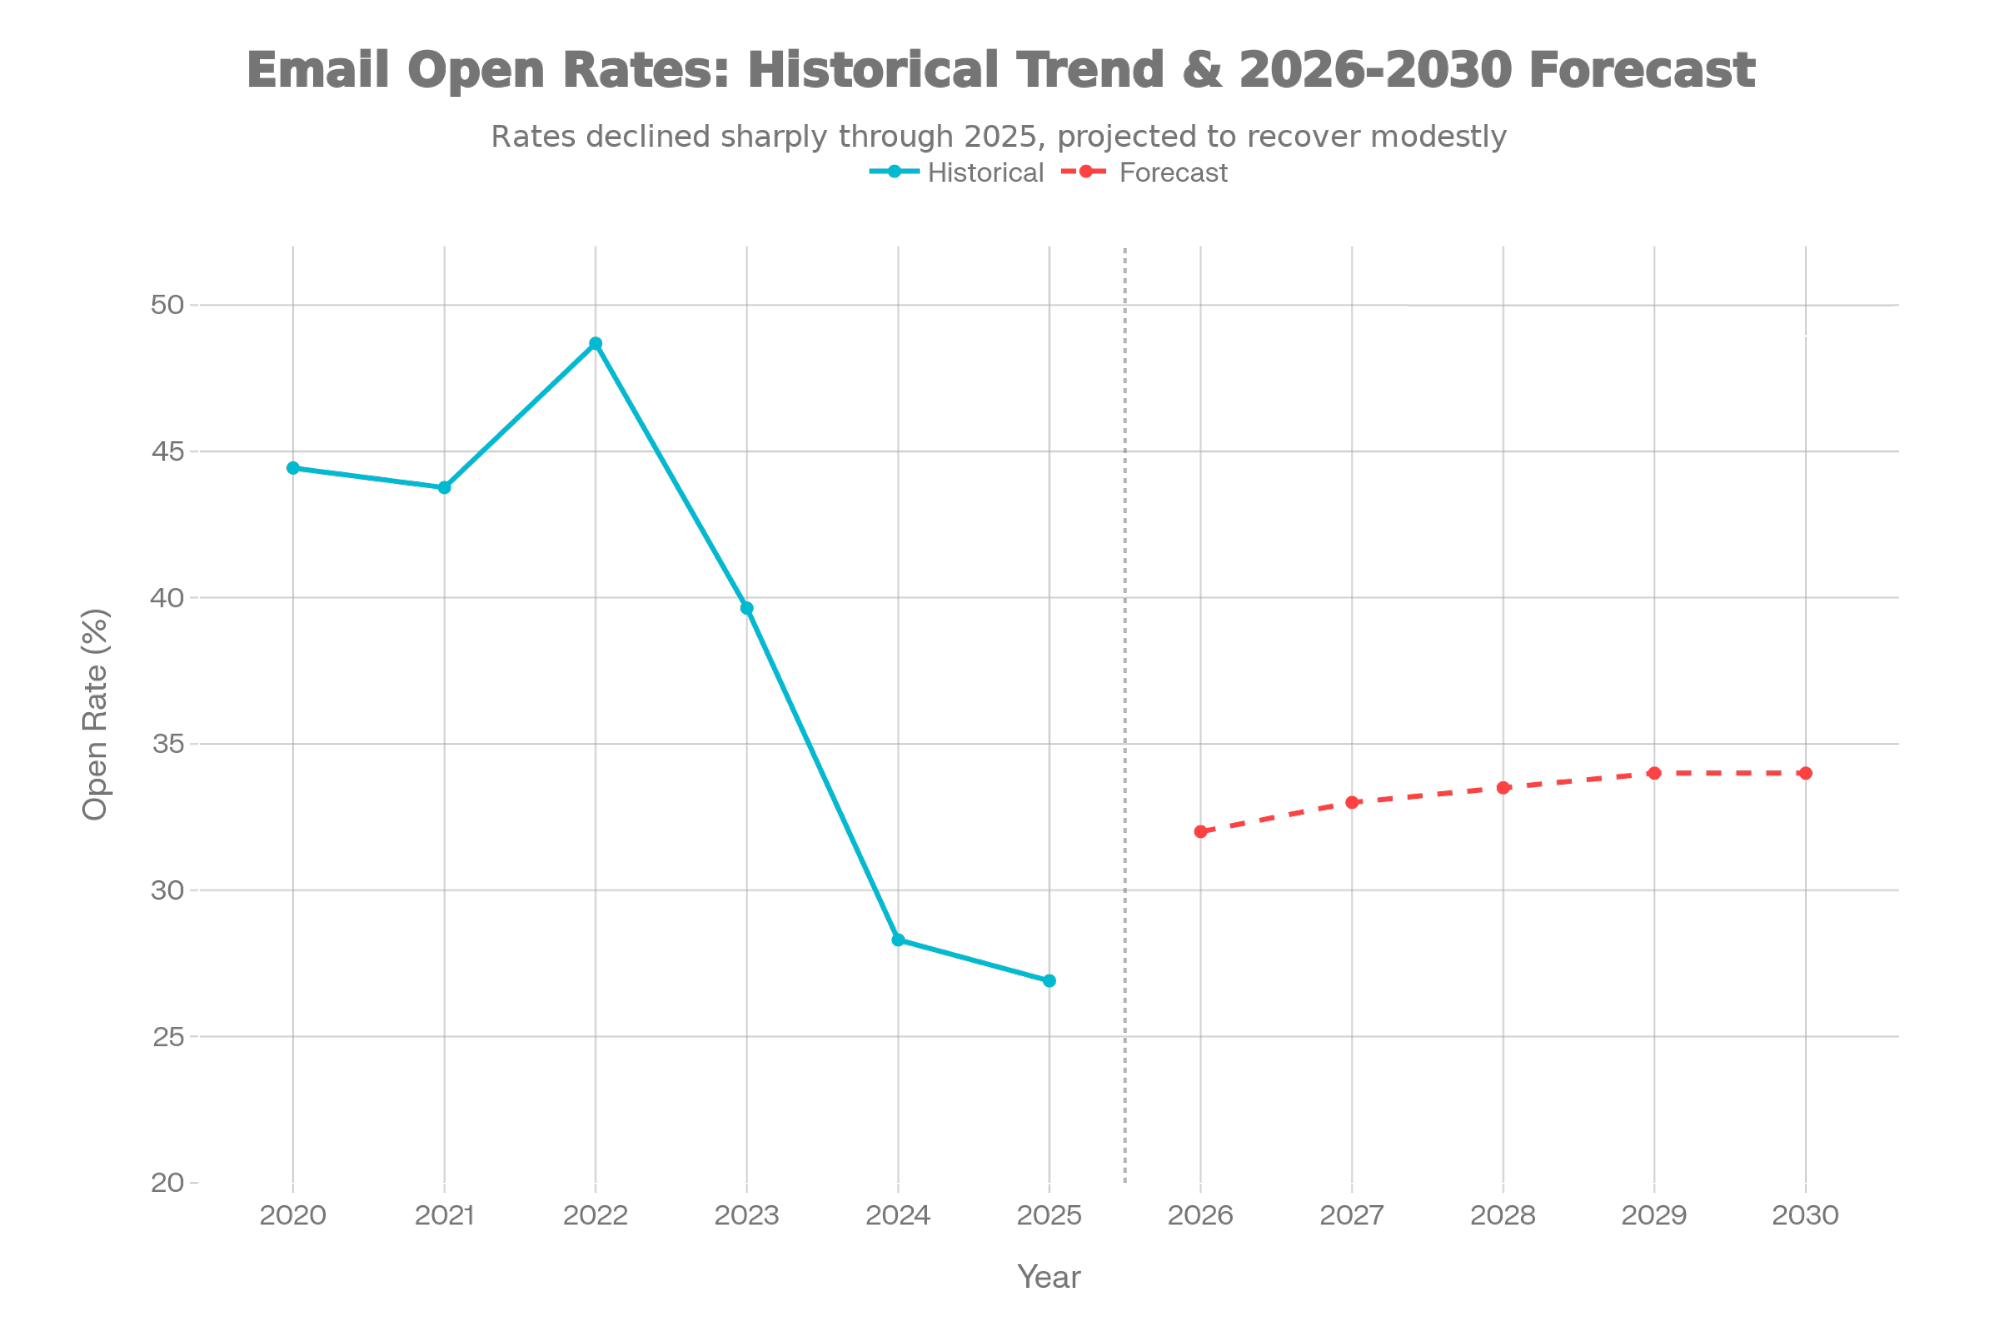
Email open rates declined from 48.69% in 2022 to 26.9% in 2025 due to Apple Mail Privacy Protection, with forecast stabilization at 32-34% through 2030
Year-by-Year Trends:
| Year | Open Rate | CTR | Conversion Rate | Key Driver |
|---|---|---|---|---|
| 2020 | 44.43% | 9.12% | — | Pre-MPP baseline |
| 2021 | 43.76% | 15.22% | 8.87% | Peak conversion performance |
| 2022 | 48.69% | 16.79% | 8.17% | Highest open rate on record |
| 2023 | 39.64% | 3.2% | — | MPP impact begins |
| 2024 | 28.3% | 2.8% | 1.9% | Full MPP effect |
| 2025 | 26.9% | 3.2% | 2.4% | Stabilization with AI recovery |
Modeled forecast methodology: Linear regression applied to 2020-2025 data with adjustment for MPP stabilization. Privacy protection artificially inflated 2020-2022 opens; 2023-2025 represents true engagement baseline. Forecast assumes continued AI optimization offsetting privacy headwinds.
B. 2025 Current Benchmarks
Core Performance Metrics (All Industries):
- Average open rate: 42.35% (range 22.57%-59.70%)
- Average CTR: 2.00%
- Click-to-open rate (CTOR): 5.63%
- Average conversion rate: 2.6%
- Bounce rate: 2.48%
- Unsubscribe rate: 0.1% globally
2024-2025 Performance Shift:
- Open rate: -1.4% decline (28.3% → 26.9%)
- CTR: +0.4% increase (2.8% → 3.2%)
- CTOR: +1.6% increase (10.2% → 11.8%)
- Conversion rate: +0.5% increase (1.9% → 2.4%)
Insight: Click-based metrics (CTR, CTOR, conversion) are rising while open rates decline, signaling a fundamental shift toward intent-based engagement. Segmentation, personalization, and AI-driven timing outweigh visibility alone.
C. 2026-2030 Projections
Open Rate Forecast (Conservative Model):
| Year | Projected Open Rate | Confidence | Methodology |
|---|---|---|---|
| 2026 | 31-34% | High | Industry consensus + AI recovery |
| 2027 | 33% | Medium | Linear extrapolation from 2025-2026 |
| 2028 | 33.5% | Medium | Plateau assumption (market saturation) |
| 2029 | 34% | Low | AI optimization ceiling effect |
| 2030 | 34% | Low | Market maturity stabilization |
Click-Through Rate Forecast:
| Year | Projected CTR | Revenue Impact | Model Basis |
|---|---|---|---|
| 2026 | 3.5% | +9.4% YoY | AI content generation growth |
| 2027 | 3.8% | +8.6% YoY | Behavioral trigger adoption |
| 2028 | 4.1% | +7.9% YoY | Interactive email elements |
| 2029 | 4.3% | +4.9% YoY | Diminishing returns phase |
| 2030 | 4.5% | +4.7% YoY | Market equilibrium |
Forecast assumptions: AI send-time optimization reaches 75% adoption by 2028, personalization becomes near-universal (97% by 2026), and behavioral triggers replace calendar-based sends. CTR growth outpaces open rate recovery due to superior content relevance and dynamic personalization.
2. AI & Personalization Adoption
A. Current Adoption Rates (2024-2025)
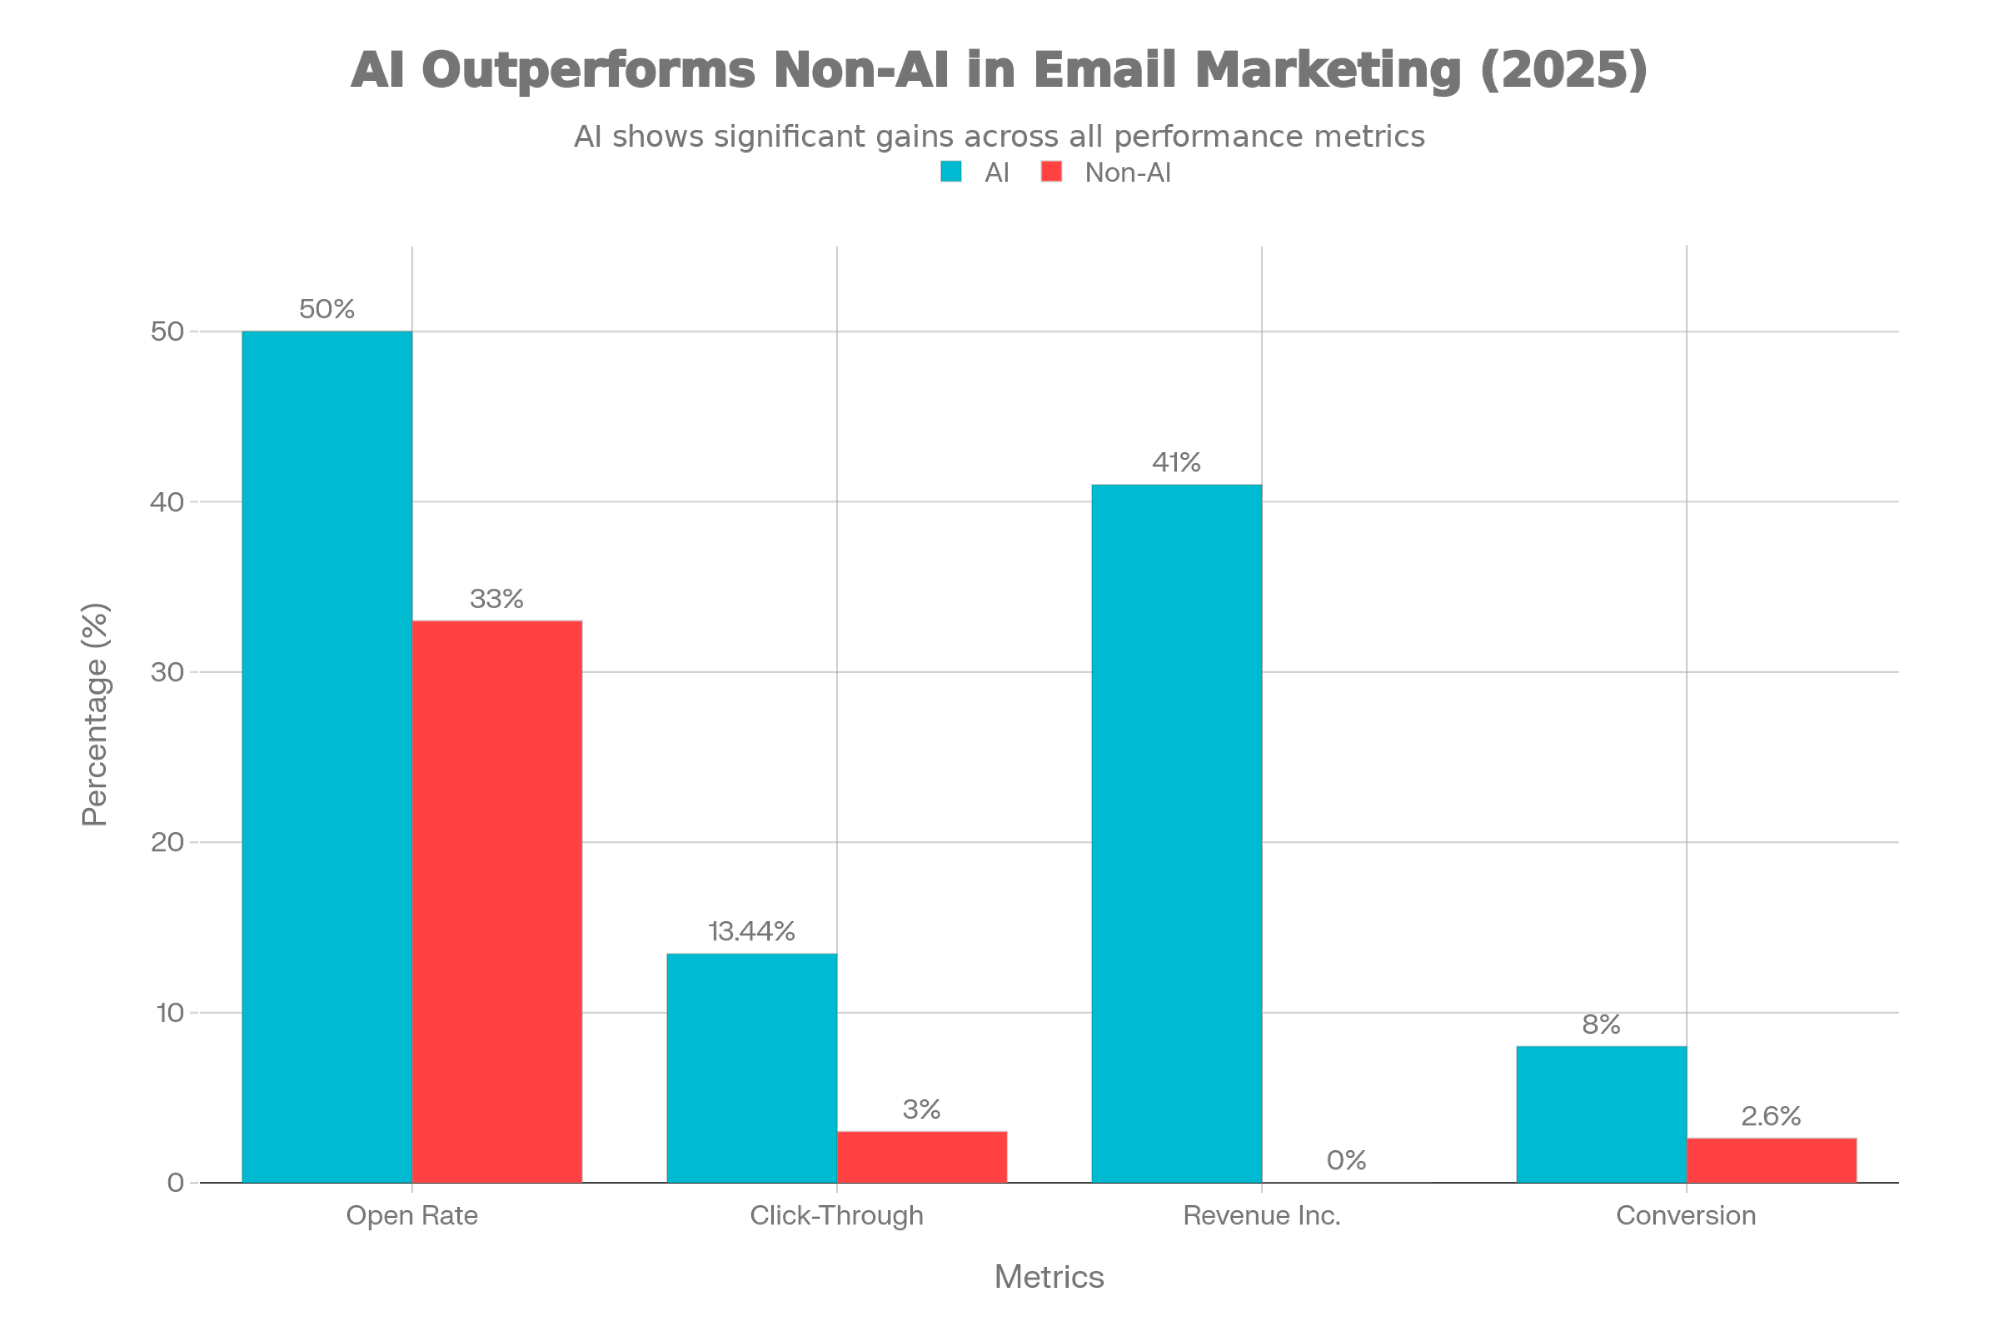
AI-driven email campaigns outperform traditional methods across all key metrics, with 41% revenue increase and 13.44% CTR vs 3% for non-AI campaigns
AI Usage Statistics:
- 64% of marketers using AI for email marketing (up from 52% in 2023)
- 49% use AI to create email content
- 50% use AI for personalization specifically
- 34% use generative AI for writing email copy
- 51% believe AI is more effective than traditional approaches
AI Application Breakdown:
| Use Case | Adoption Rate | Primary Benefit |
|---|---|---|
| Content personalization | 50% | Most common use |
| Email copywriting | 34% | Efficiency gain |
| Subject line optimization | 41% | Open rate lift |
| Send-time optimization | 29% | Engagement improvement |
| Full email copy generation | 24% | Scale enablement |
B. Performance Impact of AI
Revenue & Engagement Metrics:
- AI personalization delivers 41% revenue increase
- CTR improves to 13.44% vs 3% for non-AI campaigns
- AI-driven campaigns achieve 50% higher open rates
- AI subject lines increase opens by 41%
- Send-time optimization improves opens by 29%
Case Study - HubSpot VP of Marketing:
Achieved 82% conversion rate increase through 1:1 personalization at scale using generative AI. This result demonstrates the transformational potential of AI-powered hyper-personalization.
B2B Lead Nurturing Impact:
- 25% increase in qualified leads
- 30% reduction in sales cycles
- 35% open rate for AI-driven campaigns
- 20% CTR for personalized B2B sequences
C. 2026-2030 AI Adoption Forecast
Adoption Rate Projections:
| Year | AI Usage % | Key Milestone | Barrier Reduction |
|---|---|---|---|
| 2026 | 75% | Mainstream adoption threshold | Simplified tools |
| 2027 | 82% | Enterprise-wide integration | Cost reduction |
| 2028 | 88% | SMB accessibility | Platform embedding |
| 2029 | 93% | Near-universal adoption | Competitive necessity |
| 2030 | 97% | Market saturation | Default functionality |
Performance Uplift Trajectory:
Revenue impact from AI personalization projected to grow from 41% (2025) to 55-60% by 2030 as models improve and training data expands. However, diminishing returns emerge after 2028 as competitors adopt similar capabilities, reducing differentiation advantage.
Negative Impact Metrics:
Over-personalization risks include 0.15-0.20% unsubscribe rate increases when personalization feels invasive. GDPR and privacy regulations will constrain AI data usage, particularly in Europe where 79.4% of marketers report data activation as crucial despite regulatory pressure.
3. Automation Trends
A. Automation Adoption & Volume
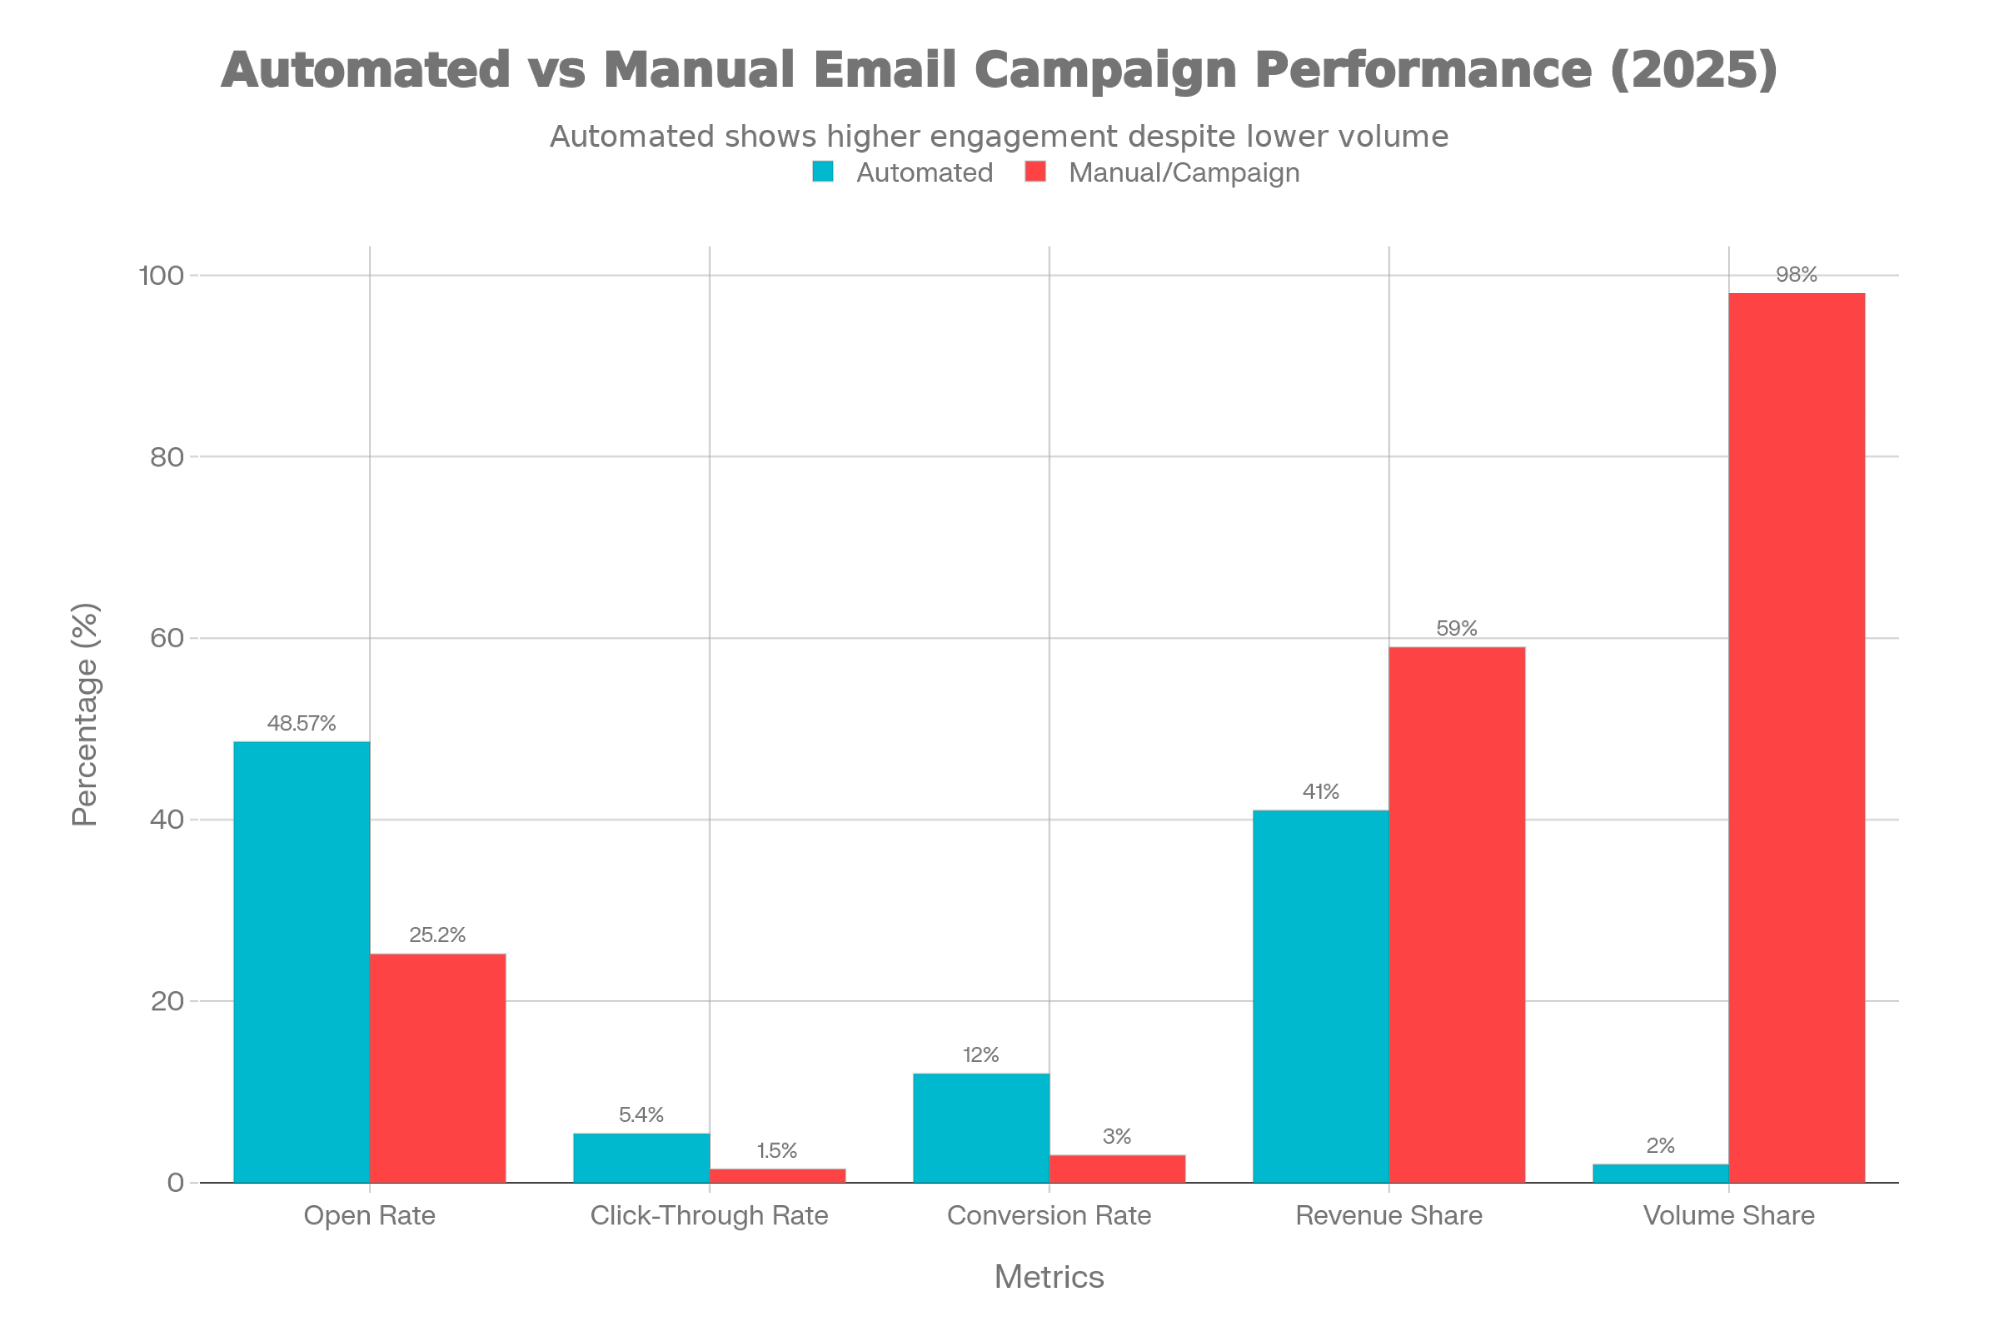
Automated emails represent only 2% of volume but drive 41% of revenue, with open rates nearly double that of manual campaigns (48.57% vs 25.2%)
Current Adoption (2025):
- 58% of businesses use automation for email marketing
- 76% of email marketers use automation tools
- 48% plan to include automation in email programs
- Automated emails: 2% of sends, 41% of revenue
Volume Growth Trends:
- 250 million more automated emails sent YoY
- Welcome emails: 2.5x increase
- Browse abandonment: 2x increase
- Back-in-stock: 4x increase
Most Common Automation Types:
- Welcome sequences (47% of marketers)
- Cart abandonment (primary revenue driver)
- Browse abandonment (2x volume growth)
- Re-engagement campaigns (67% use drip/nurture)
- Lead nurturing (451% more qualified leads)
B. Automation Performance Benchmarks
Automated vs Manual Campaign Comparison:
| Metric | Automated Flows | Manual Campaigns | Performance Gap |
|---|---|---|---|
| Open Rate | 48.57% | 25.2% | +92.7% |
| CTR | 5.4% | 1.5% | +260% |
| Conversion Rate | 12% | 3% | +300% |
| Revenue per send | High efficiency | Low efficiency | 4x higher |
ROI Metrics:
- Automated campaigns generate 320% more revenue than non-automated
- Revenue per dollar: $5.31 for automated campaigns
- Autoresponder emails: 98% open rate, 37% CTR
- Triggered emails: 8x more opens than bulk sends
C. Deliverability Impact & Future Outlook
Volume vs Quality Trade-off:
High automation volume can negatively impact deliverability if not managed properly. Inbox placement drops for senders exceeding 1,000k emails/month without proper authentication and engagement monitoring.
2026-2030 Automation Forecast:
| Year | Automated % of Revenue | Adoption Rate | Key Development |
|---|---|---|---|
| 2026 | 45% | 65% | AI-powered triggers |
| 2027 | 50% | 72% | Predictive send optimization |
| 2028 | 55% | 78% | Cross-channel orchestration |
| 2029 | 58% | 83% | Autonomous campaign management |
| 2030 | 60% | 87% | Full AI integration |
Projection methodology: Linear growth based on 2020-2025 adoption curve (2% volume → 41% revenue demonstrates efficiency gains). Forecast assumes continued platform investment and AI-powered workflow optimization. Revenue share growth outpaces volume share due to superior targeting and timing.
4. Cold Email Metrics
A. 2025 Reply Rate Benchmarks
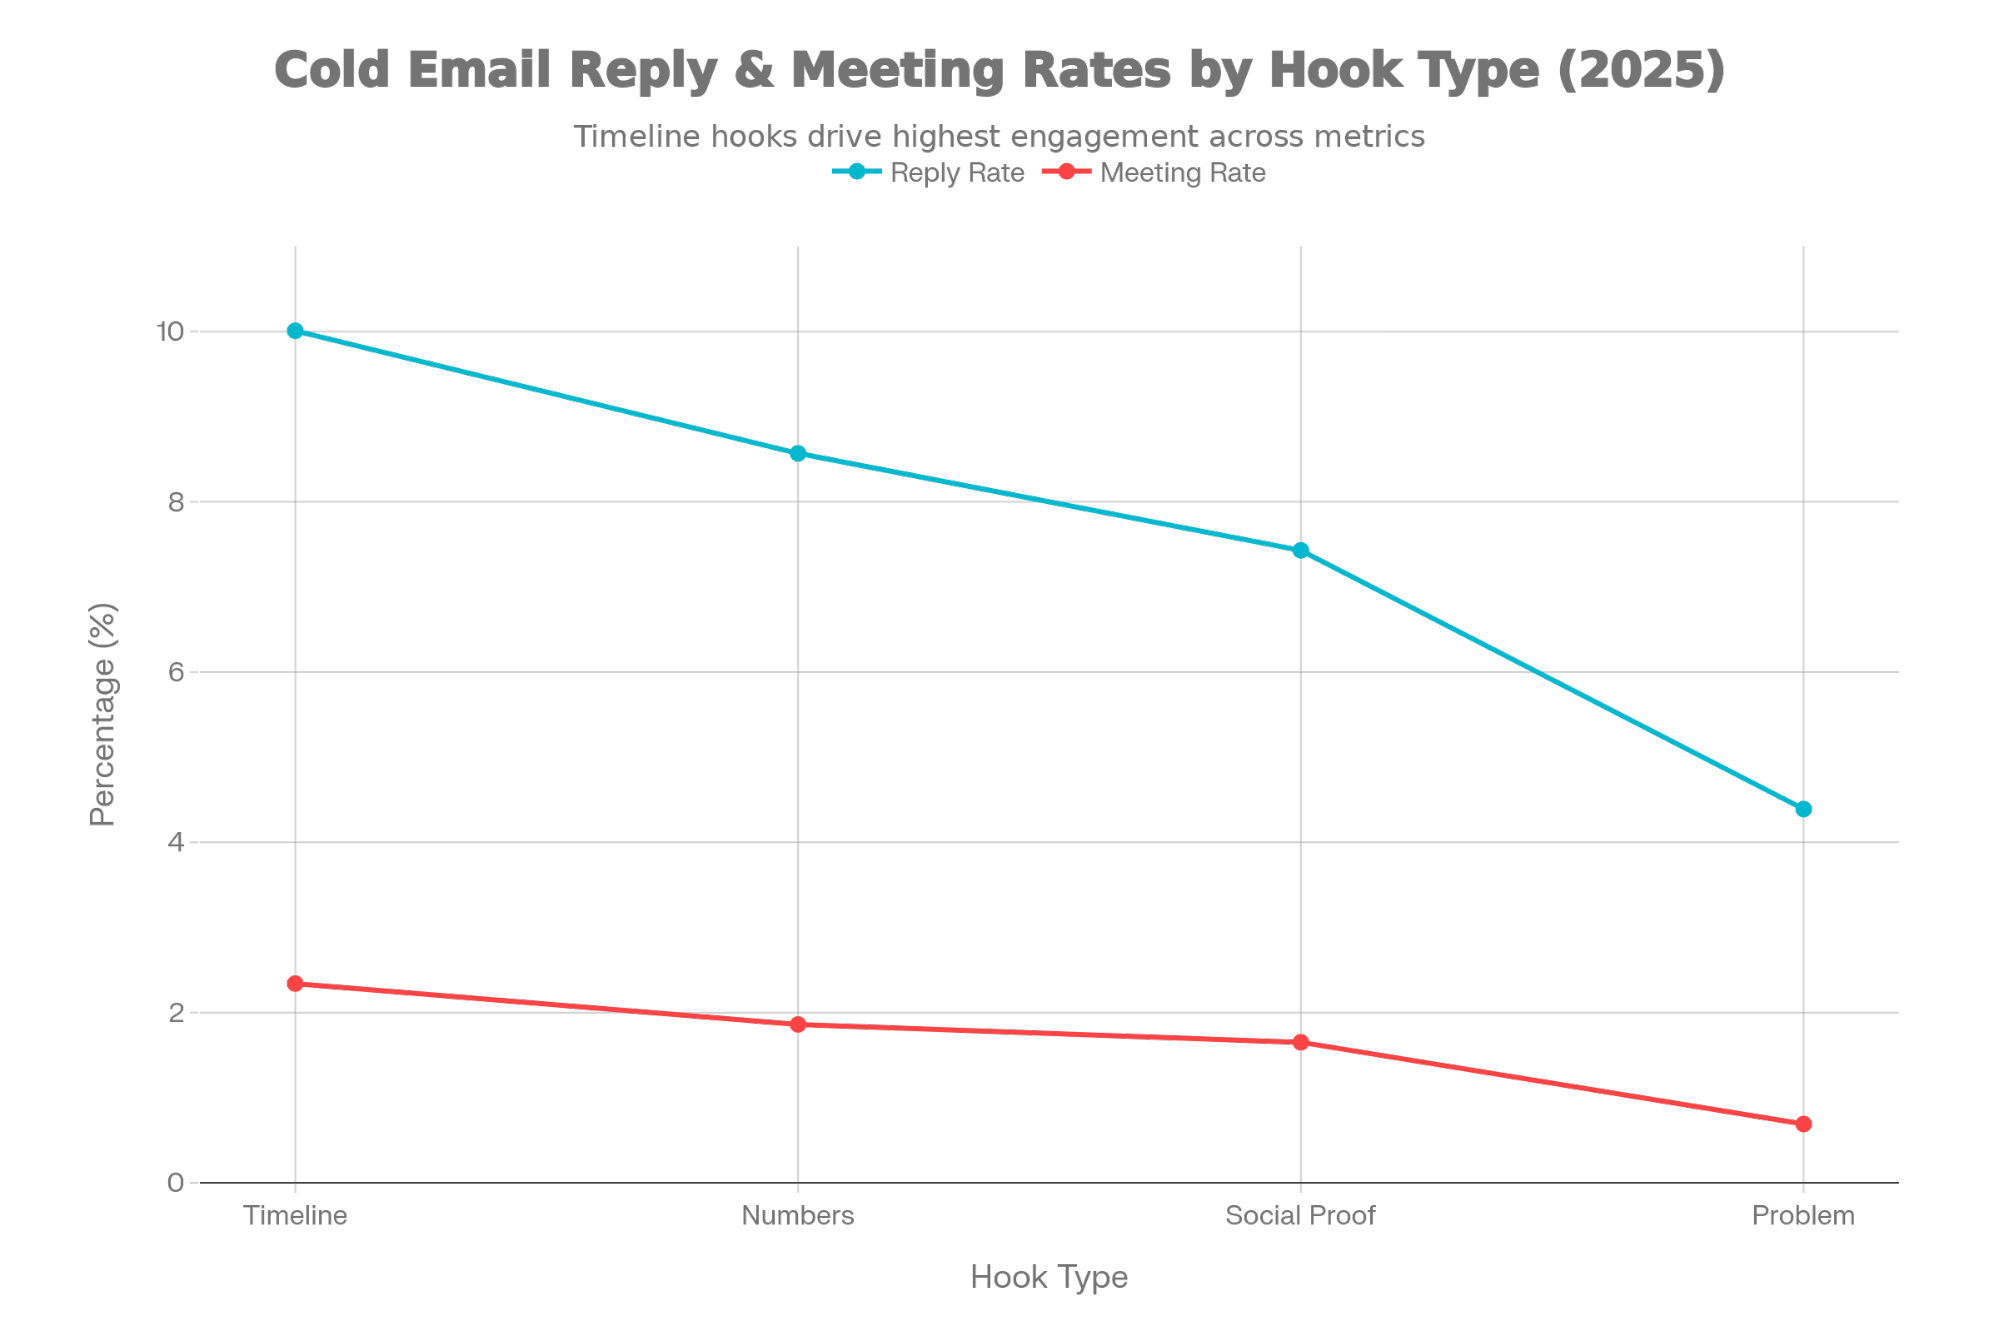
Timeline-based cold email hooks deliver 10.01% reply rates and 2.34% meeting rates, outperforming problem-based hooks by 2.3x and 3.4x respectively
Overall Cold Email Performance:
- Average reply rate: 3-5.1% (general B2B)
- Average baseline: 4.1%
- Typical range: 1-8.5%
- Top performers: 40-50% (highly targeted campaigns)
- Belkins 2025 benchmark: 5.8% reply rate (down from 6.8% in 2023)
Good/Great/Top-Tier Benchmarks:
| Performance Level | Reply Rate | Meeting Rate | Characteristic |
|---|---|---|---|
| Good | 5% | 1.5% | Table stakes baseline |
| Great | 10% | 2.5% | Strong performance |
| Top-Quartile | 15%+ | 3.5%+ | Market-beating results |
B. Hook Type Performance Analysis
Reply Rate by Hook Type (2025):
| Hook Type | Reply Rate | Meeting Rate | Positive Reply % | Use Case |
|---|---|---|---|---|
| Timeline | 10.01% | 2.34% | 62-65% | Compressed achievement windows |
| Numbers | 8.57% | 1.86% | 61.76% | Quantified outcomes, benchmarks |
| Social Proof | 7.43% | 1.65% | 58-60% | Peer success stories |
| Problem | 4.39% | 0.69% | 45-50% | Pain point identification |
Key Insight: Timeline-based hooks deliver 2.3x higher reply rates and 3.4x higher meeting rates compared to traditional problem-statement approaches. This reflects buyer psychology shift toward evidence of velocity and feasibility over problem validation.
C. Cold Email Best Practices (Data-Driven)
Optimal Email Structure:
- Length: 6-8 sentences, under 200 words
- Open rate: 42.67% for optimal length
- Reply rate: 6.9% for optimal length
- Emails under 100 characters: 5.4% reply rate
Sequence Strategy:
- Best practice: 3 total emails (1 initial + 2 follow-ups)
- Touchpoint performance:
- Initial email: ~3.0% reply rate
- Day 3 follow-up: +1.8% cumulative (+60% lift)
- Day 10 follow-up: +1.0% cumulative
- Beyond 3 touchpoints: declining returns (spam complaints offset replies)
Personalization Impact:
- Personalized subject lines: +50% open rate, +140% replies
- AI-driven personalization: 35% response rate (7x traditional methods)
- Hyper-targeted campaigns: 40-50% reply rates achievable
D. 2026-2030 Cold Email Projections
Reply Rate Forecast:
| Year | Avg Reply Rate | Top-Performer Benchmark | Model Basis |
|---|---|---|---|
| 2026 | 5.5% | 18% | AI personalization growth |
| 2027 | 6.2% | 22% | Intent data integration |
| 2028 | 6.8% | 25% | Predictive targeting |
| 2029 | 7.2% | 27% | Multi-channel coordination |
| 2030 | 7.5% | 30% | Autonomous optimization |
Forecast assumptions: AI-powered personalization adoption reaches 80% by 2028, intent data becomes standard (reducing spray-and-pray), and deliverability authentication requirements force list quality improvements. Reply rates grow as volume-based approaches become unsustainable under stricter ESP enforcement.
5. Industry-Specific Benchmarks
A. B2B Email Marketing
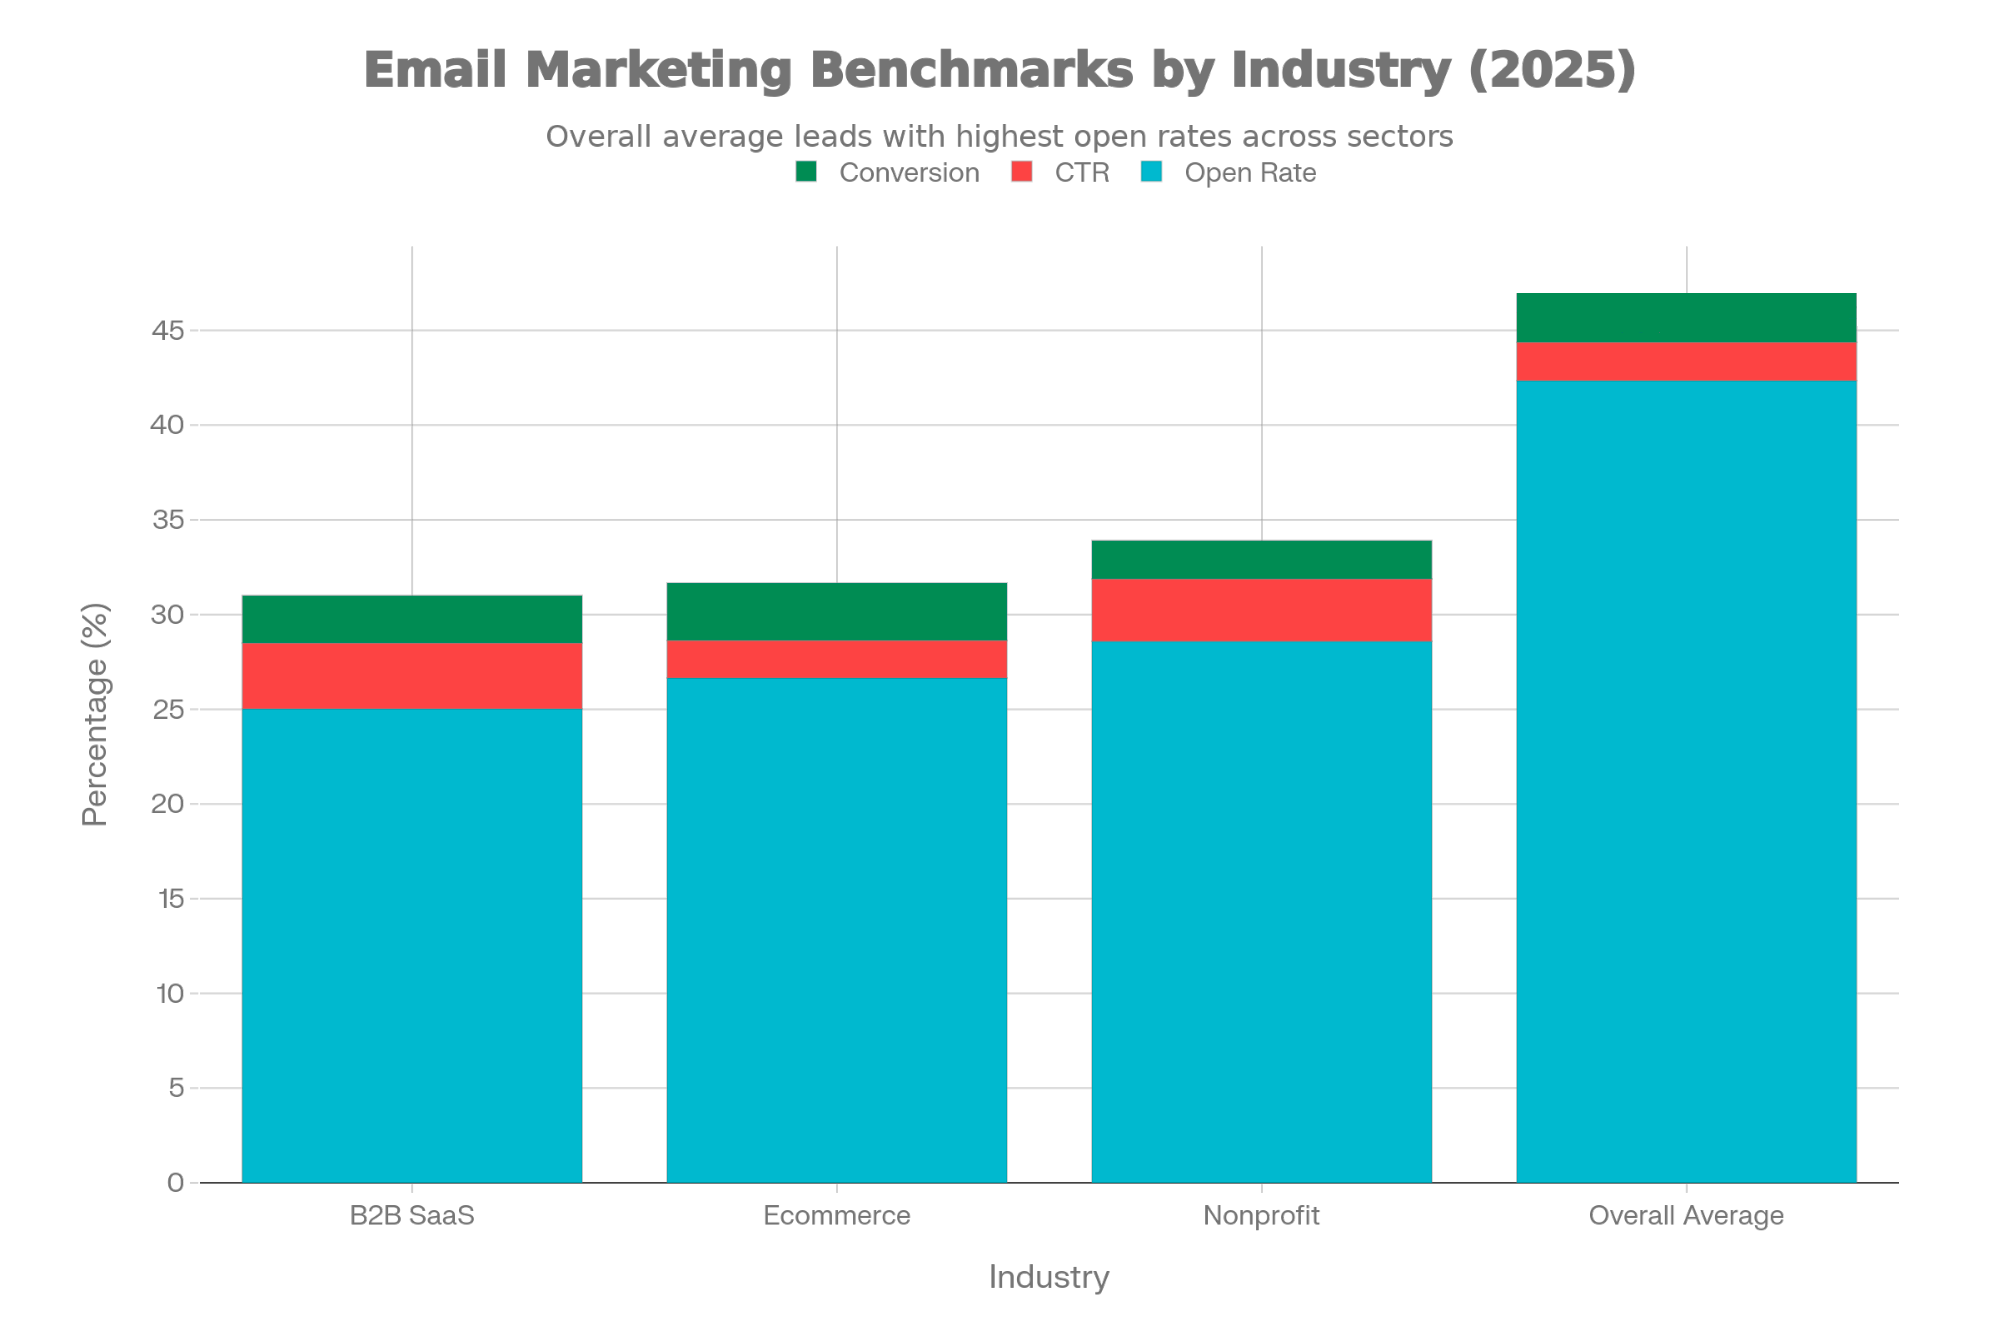
Nonprofits achieve the highest open rates at 28.59% among specialized sectors, while ecommerce leads in conversion at 3%, despite overall averages showing 42.35% opens
2025 B2B Benchmarks:
- Open rate: 20.8%
- CTR: 3.2%
- Bounce rate: 2%
- Conversion rate: 2.5%
- Spam complaint threshold: <0.1%
- Hard bounce threshold: <0.5%
B2B SaaS/Tech Specific:
- Marketing email open rate: 23-30%
- Outbound open rate: 35-45%
- CTR: 3-4%
- Reply rate target: 5-10%
- Meeting booked rate: 1-2% of total sends
B2B vs B2C Performance Split:
- B2B mobile opens: 38% (lower than B2C 55%)
- B2B email frequency: 1-2/week recommended
- B2B sales cycle: 30% reduction with automation
B. Ecommerce Email Marketing
Engagement Metrics (2025):
- Open rate: 25.1% (2023), 26.64% (2025 avg)
- CTR: 2%
- Conversion rate: 3% (automated flows)
- Unsubscribe rate: 0.27%
- Click-to-conversion growth: +27.6% in 2024
ROI & Revenue Performance:
- US ecommerce ROI: $72 per $1 spent
- Ecommerce/retail ROI: 4500% (highest sector)
- Annual revenue per subscriber: $6.86
- Email revenue share: declining but still significant
Ecommerce Email Historical Trend:
- 2020 open rate: 10.16%
- 2023 open rate: 25.1%
- Growth driver: improved personalization and automation adoption
Cart Abandonment Performance:
- Average abandonment rate: 70.19%
- Cart email open rate: 45-50%, up to 50.5%
- Cart email CTR: 21%, 6.25% (average)
- Conversion rate: 10-15% typical, 10.7% overall
- Recovery rate: 10-20%
- Revenue per cart email: $5.81
- First-hour emails: +20% conversion boost
- Three-email series: $24.9M revenue vs $3.8M single email
C. Nonprofit Email Marketing
Engagement Metrics (2025):
- Average open rate: 28.59% (exceeds for-profit 21-21.5%)
- CTR: 3.29%
- CTOR: 10.2%
- Unsubscribe rate: 0.17%
- Welcome email open rate: 80%
Fundraising Impact:
- Email inspires 33% of donors (top channel)
- Email share of online revenue: 11% in 2024 (down from 14% in 2023)
- Revenue per 1,000 emails: $58
- Revenue per email contact: $1.11 average
- Donor retention increase: +29% with email address
List Management:
- Email frequency: 62 emails/subscriber in 2024 (+9% YoY)
- List growth: 4% in 2024 (down from 6% in 2023)
- Only 38% regularly remove unengaged subscribers
- Personalization usage: 63% of nonprofits
Regional & Sector Benchmarks by Industry:
| Industry | Open Rate | CTR | Unsubscribe Rate | Top Performers |
|---|---|---|---|---|
| Religious orgs | 59.70% | — | — | Highest opens |
| Hobbies | — | 4.36% | — | Highest CTR |
| Education | 45.32% | 3-5% | — | Strong engagement |
| Healthcare | Solid opens | Low CTR | — | Content gap |
| Authors | — | — | 0.21% | Highest unsub |
| Home & Garden | — | — | 0.19% | High unsub |
6. Email Deliverability & Inbox Placement
A. Global Deliverability Benchmarks (2024-2025)
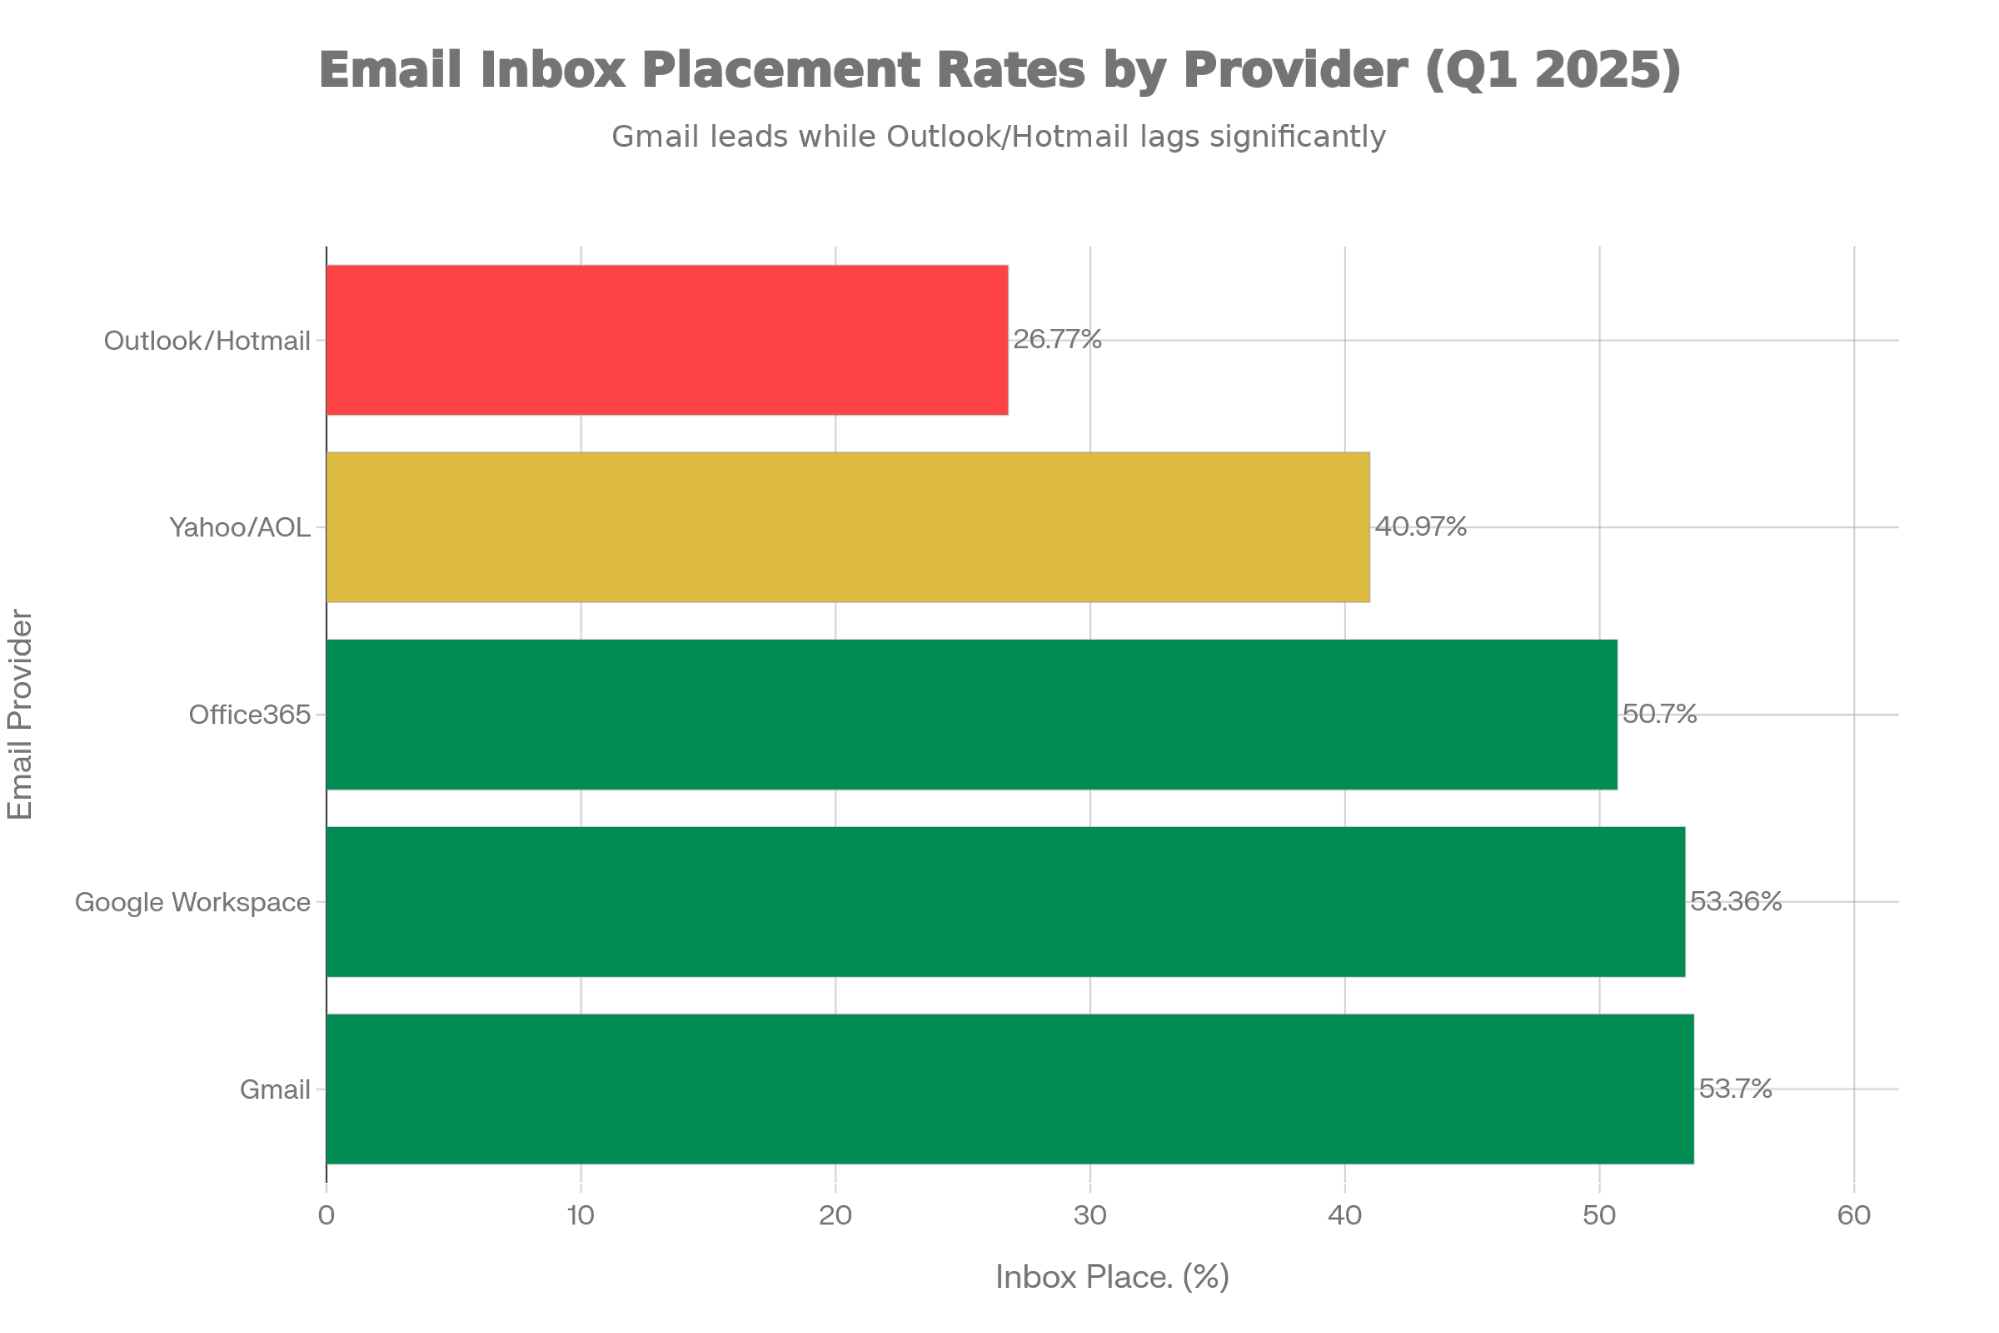
Outlook/Hotmail shows the lowest inbox placement at 26.77%, down 22.56 percentage points from Q1 2024, while Gmail maintains 53.70% placement
Overall Performance:
- Average deliverability: 83.1%
- Average inbox placement: 84%
- 16.9% never reach inbox
- 10.5% to spam folder
- 6.4% undelivered/missing
Critical Insight: Roughly 1 in 6 marketing emails never reach the inbox, representing significant revenue loss.
Q1 2025 vs Q1 2024 Provider Performance:
| Provider | Q1 2025 | Q1 2024 | Change | Impact |
|---|---|---|---|---|
| Gmail | 53.70% | 58.72% | -5.02% | Engagement filters |
| Google Workspace | 53.36% | 63.85% | -10.49% | Bulk sender rules |
| Outlook/Hotmail | 26.77% | 49.33% | -22.56% | Dramatic decline |
| Office365 | 50.70% | 77.43% | -26.73% | Strictest enforcement |
| Yahoo/AOL | 40.97% | 43.32% | -2.35% | Stable performance |
Major Concern: Office365 and Outlook/Hotmail experienced the most severe deliverability declines in Q1 2025, dropping 26.73% and 22.56% respectively. This reflects aggressive enforcement of new bulk-sender requirements.
💡 Read more: What Klaviyo deliverability issues to expect, and how to fix them.
B. Regional Deliverability Performance
Regional Inbox Placement Rates:
| Region | Inbox Placement | Key Factors | Regulatory Environment |
|---|---|---|---|
| Europe | 89.1% | GDPR compliance, lower volume | Strictest data protection |
| North America | 87.9% | SPF/DKIM/DMARC adoption | CAN-SPAM/CASL enforcement |
| Asia-Pacific | 78.2% | Wide variation by country | Mixed regulations |
| — India | 69.8% | Shared IPs, inconsistent auth | Developing infrastructure |
| — China | 92.7% | State-regulated ecosystem | Centralized control |
| — Australia/UK | 98%+ | Stringent verification | Advanced infrastructure |
Continental Email Performance:
| Continent | Open Rate | CTR | Bounce Rate |
|---|---|---|---|
| Oceania | 37.93% | 2.15% | — |
| North America | 31.02% | 2.96% | 0.57% |
| Europe | 30.69% | 2.34% | Lowest |
| South America | 22.87% | 1.25% | — |
| Asia | 19.14% | 1.46% | — |
| Africa | 19.12% | 1.16% | — |
| Asia-Pacific | — | — | 0.58% |
| Latin America | — | — | 0.63% |
Europe Performance Advantage: Europe's 89.1% inbox placement rate stems from GDPR-driven list accuracy and lower email volume compared to North America. Europeans send fewer emails to more accurate addresses, resulting in superior deliverability.
C. 2026-2030 Deliverability Forecast
Inbox Placement Projections:
| Year | Avg Inbox Placement | Gmail | Outlook | Trend Driver |
|---|---|---|---|---|
| 2026 | 82% | 51% | 24% | Continued enforcement |
| 2027 | 81% | 50% | 22% | Authentication requirement |
| 2028 | 83% | 52% | 25% | AI filtering improvement |
| 2029 | 84% | 54% | 27% | Sender adaptation |
| 2030 | 85% | 55% | 29% | Market stabilization |
Forecast methodology: Assumes continued ESP enforcement of authentication (SPF/DKIM/DMARC) and engagement-based filtering. Outlook/Hotmail projected to remain lowest performer. Recovery begins 2028 as senders adapt to new requirements. Conservative estimate reflects regulatory pressure and user protection prioritization.
Authentication Requirements: Gmail and Yahoo enforce spam complaint rates <0.3% and authentication protocols as of 2024. Non-compliance results in immediate deliverability penalties.
7. Mobile Email Statistics
A. Device Usage & Behavior (2025)
Device Split:
- Mobile opens: 55% globally
- Webmail: 40.6%
- Desktop app: 16.2%
- iPhone alone: 28.4% of mobile opens
- B2B mobile opens: 38% (lower than consumer)
Mobile Engagement Patterns:
- 85% access email on mobile daily
- 42% delete non-optimized emails within 3 seconds
- Mobile response time: 54% faster than desktop (28 min vs 62 min)
- Mobile offer usage: 10x higher than print
- Check frequency: Up to 20 times daily
Mobile Optimization Impact:
- Mobile-optimized emails: +15% conversion rate
- Mobile campaign optimization: 80% of campaigns
- First link clicks: 30% higher on mobile-optimized emails
B. Regional & Demographic Patterns
Mobile Adoption by Demographic:
- Gen Z: Primary mobile users (highest adoption)
- Millennials: 59% use smartphones as primary platform
- 65+ demographic: 6.1% CAGR growth (fastest-growing)
Regional Mobile Trends:
- North America smartphone adoption: 84%
- Global mobile vs desktop split evolving rapidly
- Emerging markets driving future mobile growth
C. 2026-2030 Mobile Forecast
Mobile Open Share Projections:
| Year | Mobile Opens % | Desktop/Webmail % | Key Development |
|---|---|---|---|
| 2026 | 58% | 42% | Continued mobile shift |
| 2027 | 61% | 39% | Gen Z market dominance |
| 2028 | 64% | 36% | Wearable integration |
| 2029 | 67% | 33% | Voice email previews |
| 2030 | 70% | 30% | Mobile-first default |
Projection basis: Linear extrapolation of 2020-2025 mobile growth trend (+2-3% annually). Assumes continued smartphone penetration in emerging markets and generational workforce shift. Desktop maintains niche for detailed review/work contexts.
8. Spam, Unsubscribe & Engagement Rates
A. Unsubscribe Rate Benchmarks (2025)
Global & Regional Averages:
- Global average: 0.1%
- North America: 0.39%
- Ecommerce: 0.27%
- Nonprofit: 0.17%
- B2B acceptable: <0.5%
Performance Thresholds:
| Rating | Unsubscribe Rate | Interpretation | Action Required |
|---|---|---|---|
| Excellent | <0.2% | Optimal performance | Maintain strategy |
| Good | 0.2-0.5% | Acceptable range | Monitor trends |
| Warning | 0.5-1.5% | Review needed | Adjust frequency/content |
| Critical | >1.5% | Serious issues | Immediate intervention |
Industry-Specific Unsubscribe Rates:
- Authors: 0.21% (highest)
- Photo/video: 0.20%
- Home & garden: 0.19%
- Average across industries: 0.1%
2024-2025 Trend: Unsubscribe rates decreased from 0.17% (2024) to 0.14% (2025), driven by frequency optimization and better segmentation.
B. Spam Complaint Rates & Requirements
Compliance Thresholds:
- Gmail/Yahoo requirement: <0.3% spam complaint rate
- Average spam flagging: 45.6% of all emails
- Typical complaint rate: 0.03-0.1%
2024-2025 Evolution: Gmail and Yahoo introduced bulk-sender rules in 2024 requiring one-click unsubscribe and authentication, forcing spam complaint rates below 0.3%. Non-compliance triggers immediate deliverability penalties.
C. Engagement Decay Patterns
Frequency Impact:
- Optimal B2C frequency: 1-3 emails/week
- Optimal B2B cold: 3 total emails max
- Nonprofit average: 62 emails/year (+9% YoY)
Engagement Tiers by Inactivity:
| Inactivity Period | Action | Frequency Adjustment | Expected Recovery |
|---|---|---|---|
| 30-60 days | Reduce by 50% | Weekly → Biweekly | 15-25% |
| 60-90 days | Minimal contact | 1x monthly | 5-10% |
| 90+ days | Re-engagement/remove | Last attempt | 2-5% |
List Growth & Churn:
- Average list growth: 25% annually
- Nonprofit list growth: 4% in 2024 (down from 6% in 2023)
- Email list natural decay: 9% unsubscribed, 7% bounced (2024)
- Only 35-38% of nonprofits regularly clean lists
D. 2026-2030 Engagement Projections
Unsubscribe Rate Forecast:
| Year | Avg Unsubscribe Rate | North America | Model Basis |
|---|---|---|---|
| 2026 | 0.12% | 0.38% | Preference center adoption |
| 2027 | 0.14% | 0.37% | Better segmentation |
| 2028 | 0.15% | 0.36% | AI frequency optimization |
| 2029 | 0.16% | 0.35% | Predictive disengagement |
| 2030 | 0.17% | 0.34% | Market equilibrium |
Forecast assumption: One-click unsubscribe mandates (Gmail/Yahoo) temporarily increase unsubscribe visibility but improve long-term list health. AI-powered frequency optimization and preference centers enable subscribers to self-regulate, reducing frustration-driven unsubscribes.
9. ROI & Revenue Metrics
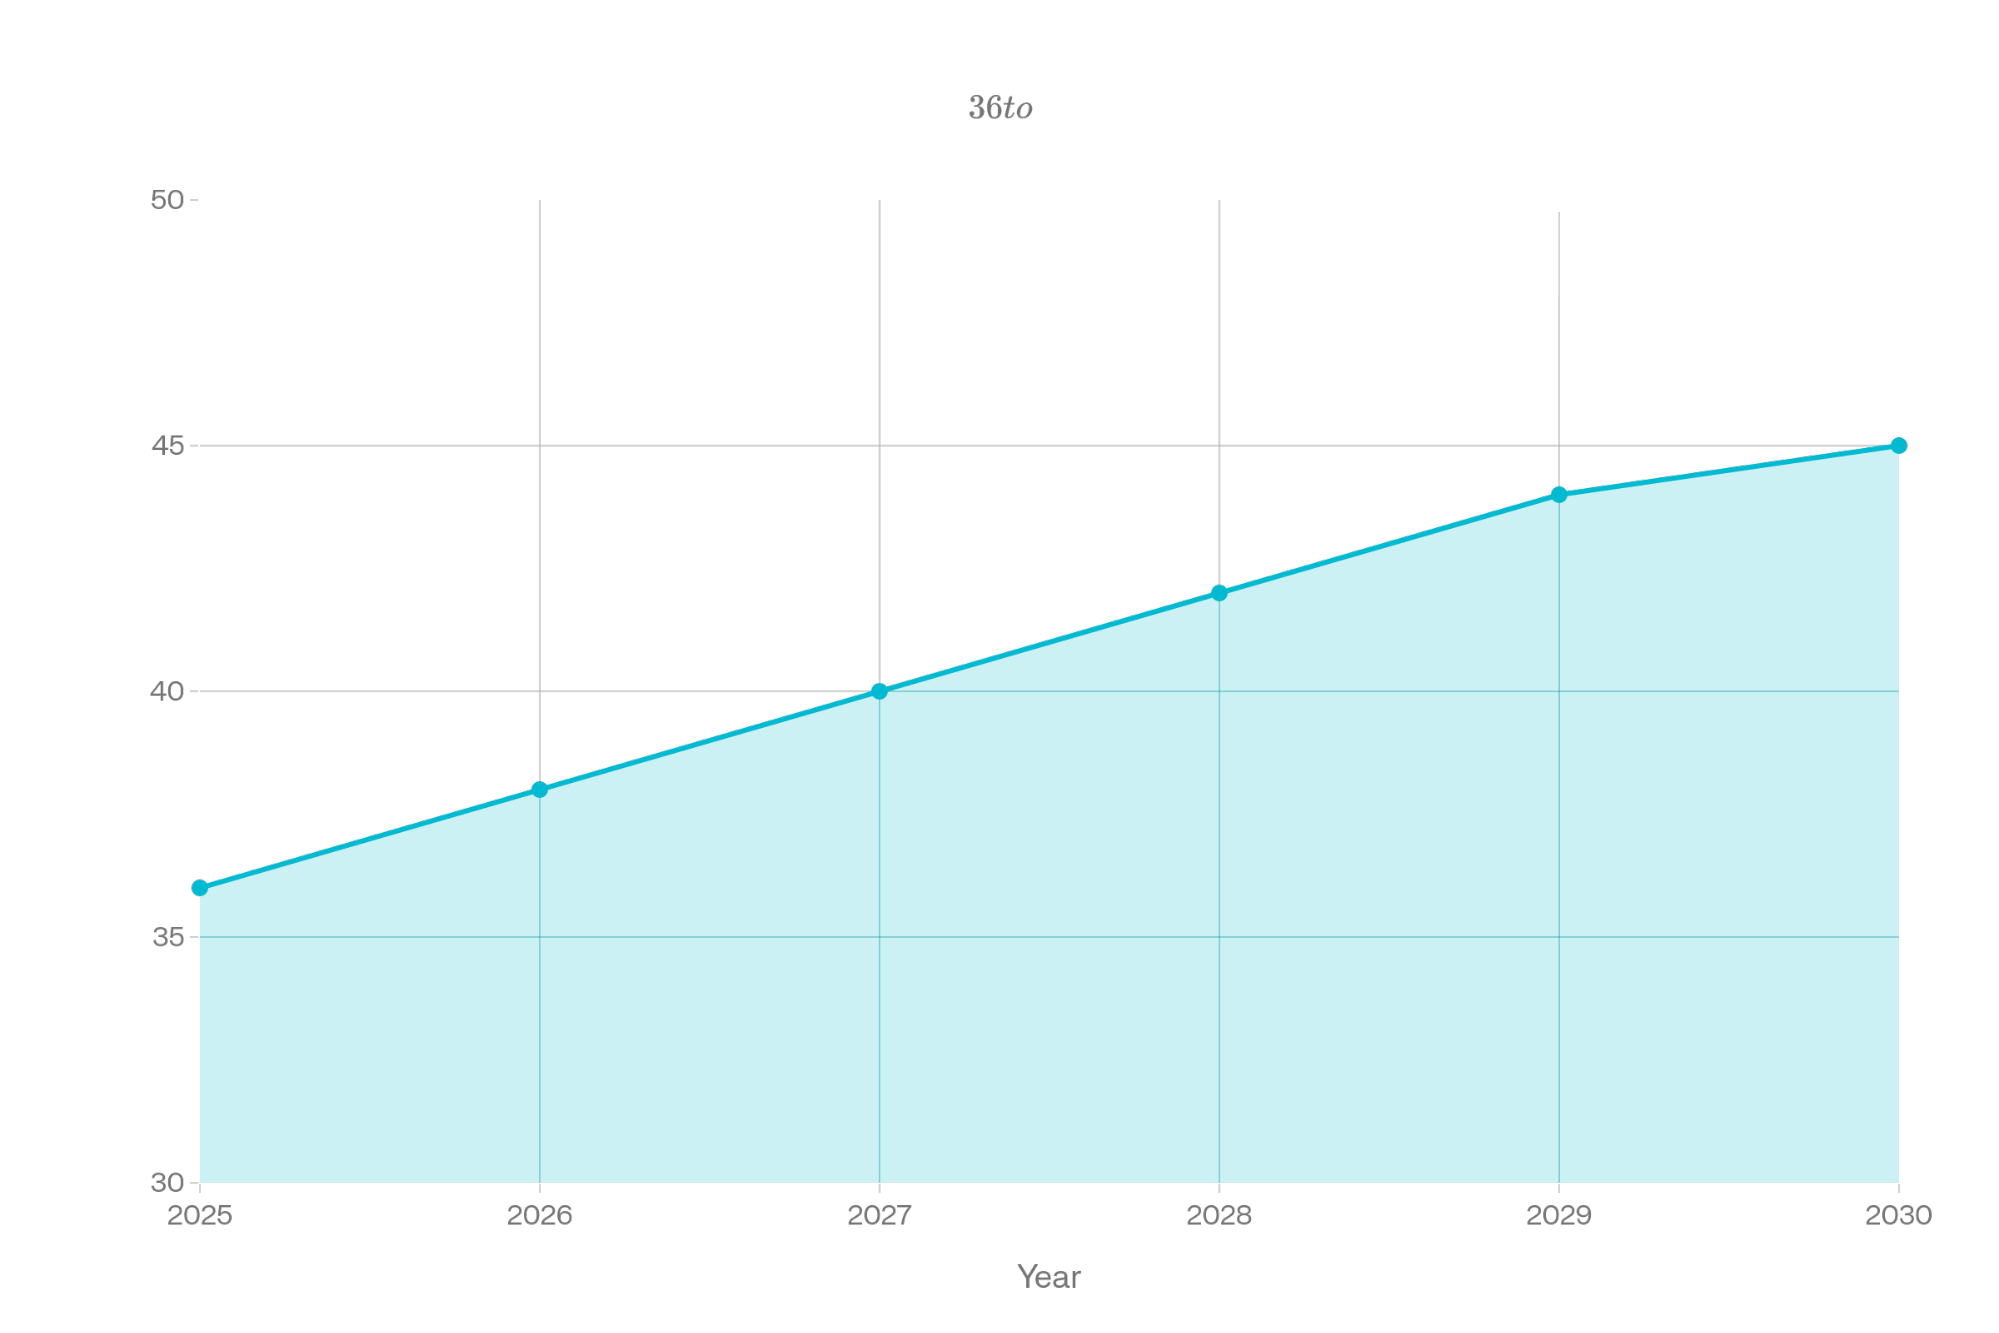
Email marketing ROI projected to grow from $36 to $45 per dollar spent by 2030, with industry revenue nearly doubling from $11.3B to $21.8B
A. 2025 ROI Performance
Overall Email Marketing ROI:
- Average: $36-40 per $1 spent
- Range: $36-72 depending on optimization
- Top performers: $70+ per $1 (18% of companies)
- With A/B testing: $48 per $1
- Median ROI: 122% (4x higher than other digital channels)
ROI by Strategy:
- Personalization ROI: $43 per $1 (vs $12 without)
- Automated campaigns: $5.31 per $1
- Ecommerce (US): $72 per $1
- Retail/consumer goods: 4500% ROI
- Segmentation: 760% revenue increase
Email vs Other Channels:
- Email: $40 per $1
- Email median ROI: 122%
- Other digital channels: ~30% median ROI
- Email rated most effective by 42% of marketers
- Email conversion rate: 6.5% (outperforms social media)
B. Revenue Attribution & Impact
Revenue Share:
- Email marketing revenue (2025): $11.3 billion
- Nonprofit email revenue share: 11% of online revenue (down from 14% in 2023)
- Automated emails: 41% of revenue from 2% of sends
- Segmented campaigns: up to 760% revenue increase
B2B Revenue Impact:
- 42% of B2B companies don't reach $36 per $1 benchmark
- B2B budget allocation: 12% to email
- 50% of marketers rate email "extremely/very effective" for ROI
C. 2026-2030 ROI & Revenue Projections
ROI Growth Forecast:
| Year | ROI per $1 | Revenue (Billions) | CAGR | Key Growth Driver |
|---|---|---|---|---|
| 2025 | $36 | $11.3B | — | Baseline |
| 2026 | $38 | $13.5B | 19.5% | AI personalization scale |
| 2027 | $40 | $15.8B | 17.0% | Automation maturity |
| 2028 | $42 | $18.2B | 15.2% | Cross-channel attribution |
| 2029 | $44 | $20.1B | 10.4% | Market saturation onset |
| 2030 | $45 | $21.8B | 8.5% | Competitive equilibrium |
Alternative Revenue Projection (Mordor Intelligence):
- 2025: $12.88 billion
- 2030: $22.81 billion
- CAGR: 12.11%
Another Source (Growth Market Reports):
- 2025: $14.8 billion
- 2033: $36.3 billion
- CAGR: 11.7%
Forecast methodology consensus: All sources project 11-19% CAGR through 2030, driven by AI adoption, automation efficiency, and global user growth (4.83B → 5.61B). ROI per dollar increases moderately as targeting improves but faces diminishing returns as competitors adopt similar technologies. Revenue growth outpaces ROI growth due to volume expansion and market penetration.
10. Design, UX & Emerging Trends
A. Dark Mode Adoption & Impact (2024-2025)
User Adoption Statistics:
- 35% of email opens in dark mode (2022)
- 82% of smartphone users use dark mode (2024)
- 81.9% of Android users enable dark mode
- 41% of Litmus subscribers use dark mode
- iOS users: 37% use dark mode on devices, 7.5% in Apple Mail
- 82.7% of users transition to dark mode after 10 PM
Marketer Optimization Rates:
- December 2020: 0.35% of emails optimized
- July 2022: 5% optimized
- November 2023: 10%+ (breakthrough threshold)
- May 2023: 9.64% (peak)
- 62% of marketers always test for dark mode
- 48% of B2C brands optimize vs 39% B2B
Adoption Phases:
- Phase 1 (Dec 2020-Summer 2021): 0.5-1.5% (slow crawl)
- Phase 2 (Late 2021): 1.5-4.9% (rapid growth)
- Phase 3 (2022-2023): 5-10% (maturity plateau)
2026-2030 Dark Mode Forecast:
| Year | User Adoption | Marketer Optimization | Gap |
|---|---|---|---|
| 2026 | 42% | 18% | 24% |
| 2027 | 48% | 28% | 20% |
| 2028 | 53% | 40% | 13% |
| 2029 | 58% | 55% | 3% |
| 2030 | 62% | 68% | -6% (optimization exceeds need) |
Projection basis: User adoption follows smartphone dark mode penetration curve. Marketer optimization accelerates as platform tools improve and competitive pressure increases. Optimization overtakes adoption by 2030 as it becomes default best practice.
B. Plain Text vs HTML Performance
Deliverability & Engagement:
- Plain text CTR: 21-51% higher than HTML
- Plain text: 42% more clicks vs HTML with GIFs
- Adding images/GIFs: 23-37% open rate drop
- Plain text: superior inbox placement, fewer spam triggers
Use Case Performance:
| Email Type | Format Winner | Performance Metric | Context |
|---|---|---|---|
| Cold outreach | Plain text | 60% open rate vs 40% HTML | Personal feel |
| Triggered/1:1 | Plain text | 20% → 60% open lift | Authenticity signal |
| Brand/promotional | HTML | Visual engagement | Recognition value |
| Newsletter | HTML | Content richness | Information density |
Detailed Comparison:
| Factor | HTML | Plain Text |
|---|---|---|
| Deliverability | Lower (spam triggers) | Higher (fewer issues) |
| CTR | Lower (21-51% gap) | Higher baseline |
| Visual appeal | High (branding) | Minimal (content focus) |
| Loading speed | Slower (images/code) | Instant (all devices) |
| Inbox placement | Lower rates | Higher rates |
| Spam filter risk | High (tracking pixels) | Low (minimal elements) |
2026-2030 Format Trends:
Plain text usage projected to increase for cold outreach and triggered emails (20% → 35% by 2028), while HTML remains dominant for brand/promotional content (95%+ market share maintained). Hybrid approaches combining plain-text simplicity with minimal HTML formatting emerge as middle ground.
C. Interactivity & AMP Email
Interactive Element Adoption:
- 97% of marketers used at least one interactive element in 2025
- Interactive emails: up to 300% CTR increase
- Projected near-100% adoption by 2026
Interactive Email Types:
- Polls/surveys: 12% of nonprofits use
- Animated GIFs: 18% of nonprofits use
- Countdown timers: 6% of nonprofits use
- Emojis: 35% of nonprofits use
AMP Email Opportunities:
- In-email product browsing
- Real-time content updates
- Form submissions without leaving inbox
- Micro-targeted ads via AMP (2028 projection)
D. Accessibility & Inclusive Design
Current State (2025):
- Accessibility adoption: growing but data limited
- 53% of emails opened on mobile (accessibility-friendly)
- Dark mode compatibility: emerging priority
- Alt-text usage: inconsistent implementation
2026-2030 Accessibility Forecast:
- Regulatory pressure increases (EU Accessibility Act, ADA)
- Platform-enforced accessibility standards (2027-2028)
- Screen reader optimization becomes standard
- Color contrast requirements formalized
- Keyboard navigation testing mandatory
11. Regional Market Analysis
A. North America
Performance Benchmarks:
- Open rate: 31.02%
- CTR: 2.96% (highest globally)
- Bounce rate: 0.57%
- Unsubscribe rate: 0.39% (above global 0.1%)
- Inbox placement: 87.9%
Market Characteristics:
- Smartphone adoption: 84%
- Email budget increases: 38% of brands
- CAN-SPAM/CASL enforcement: mature regulatory environment
- Projected daily emails (2027): 408 billion globally
B. Europe
Performance Benchmarks:
- Open rate: 30.69%
- CTR: 2.34%
- Inbox placement: 89.1% (highest globally)
- Bounce rate: Lowest globally
GDPR Impact (2024-2025):
- €4.48 billion in GDPR fines (2024)
- €2.92 billion (2022, +168% YoY)
- 79.4% of marketers say data activation crucial despite restrictions
- List quality dramatically improved post-GDPR
- Smaller, more engaged audiences (better metrics)
Country-Specific Data:
- Germany e-mail advertising: €0.46B (2024) → €0.53B (2029), 2.87% CAGR
- Switzerland: high digital literacy, personalized content focus
- UK, France, Germany, Italy: major markets
GDPR Enforcement Trends (2025):
- Faster investigation processes (months vs years)
- Email marketing priority enforcement area
- Spain: 1,021 fines, €120.75M total (Sept 2025)
- Orange (France): €50M fine (Dec 2024) for inbox ads
C. Asia-Pacific
Performance Benchmarks:
- Open rate: 19.14% (lowest)
- CTR: 1.46%
- Bounce rate: 0.58% (highest)
- Inbox placement: 78.2% average
Country-Level Variation:
- India: 69.8% deliverability (challenges: shared IPs, inconsistent auth)
- China: 92.7% deliverability (state-regulated ecosystem)
- Australia: 98%+ deliverability (stringent verification)
Growth Markets:
- India + Nigeria: 28% of new email users through 2030
- Africa/SE Asia: e-commerce boom (2029-2030)
- Fastest-growing regions globally
D. Other Regions
Latin America:
- Open rate: 22.87%
- CTR: 1.25%
- Bounce rate: 0.63% (highest)
Africa:
- Open rate: 19.12% (lowest)
- CTR: 1.16% (lowest)
- South Africa email usage: 97.1% of internet users
Oceania:
- Open rate: 37.93% (highest globally)
- CTR: 2.15%
12. 2026-2030 Future Outlook Summary
A. User & Volume Growth
Global Email Users:
- 2025: 4.83 billion
- 2027: 4.89 billion
- 2030: 5.61 billion
- CAGR: 3.4%
Daily Email Volume:
- 2025: 392 billion
- 2026: 396 billion (projected)
- 2027: 408 billion
- 2030: 523 billion
Growth Drivers:
- Emerging markets (India, Nigeria, Africa)
- Aging populations adopting digital (65+ at 6.1% CAGR)
- Remote work/education mandates
B. Technology Trends (2026-2030)
AI Evolution:
- 2026: 75% adoption, mainstream threshold
- 2028: 88% adoption, SMB accessibility
- 2030: 97% near-universal, default functionality
Automation Maturity:
- 2026: 45% of revenue from automated emails
- 2028: 55%, cross-channel orchestration
- 2030: 60%, autonomous campaign management
Send-Time Optimization:
- Individual-level optimization: 50.7% believe AI more effective
- AI-driven: 13% CTR increase, 41% revenue lift
- Mainstream adoption by 2027-2028
C. Regulatory & Privacy Landscape
Compliance Evolution:
- Gmail/Yahoo bulk-sender rules (2024): authentication + <0.3% spam
- One-click unsubscribe: mandatory enforcement
- GDPR fines escalating: €4.48B (2024)
- Privacy-first personalization: balancing act
Data Residency:
- EU infrastructure requirements tightening
- Regional processing becomes standard
- International transfer restrictions increase
D. Performance Benchmarks Forecast Summary
2030 Projected Benchmarks:
| Metric | 2025 | 2030 Forecast | Change | Driver |
|---|---|---|---|---|
| Open Rate | 26.9-42.35% | 32-34% | Stabilization | AI recovery |
| CTR | 2-3.2% | 4.5% | +41-125% | Personalization |
| Conversion | 2.4-2.6% | 4% | +54-67% | Automation |
| ROI per $1 | $36-40 | $45 | +12-25% | Efficiency |
| Revenue | $11.3B | $21.8B | +93% | Market growth |
| AI Adoption | 64% | 97% | +52% | Platform integration |
| Mobile Opens | 55% | 70% | +27% | Device shift |
| Inbox Placement | 84% | 85% | +1% | Authentication |
13. Key Insights & Strategic Implications
Critical Takeaways for 2026-2030:
1. AI is Non-Negotiable
With 64% current adoption growing to 97% by 2030, AI-driven personalization, send-time optimization, and content generation become table stakes. Marketers not adopting AI will face 41% revenue disadvantage.
2. Automation Efficiency Paradox
Automated emails represent 2% of volume but 41% of revenue—a 20:1 efficiency ratio. Focus on quality workflows over quantity sends.
3. Deliverability Crisis Requires Action
With average inbox placement at 84% and Office365 at 26.77%, authentication (SPF/DKIM/DMARC) and engagement optimization are survival requirements, not best practices.
4. Mobile-First is Now Mobile-Only
At 55% opens (growing to 70% by 2030), mobile optimization is mandatory. 42% delete non-optimized emails within 3 seconds.
5. Privacy & Personalization Balance
GDPR fines reached €4.48B in 2024. Privacy-compliant personalization through first-party data and consent management is the only sustainable path.
6. Cold Email Sophistication Required
Timeline-based hooks (10.01% reply rate) outperform problem hooks (4.39%) by 2.3x. Volume-based cold email is dead; precision targeting wins.
7. Segmentation Drives Revenue
Segmented campaigns deliver up to 760% revenue increases. Generic blast emails leave massive revenue on the table.
8. ROI Remains Exceptional
Email's $36-45 per dollar ROI dwarfs other channels and will grow as AI and automation improve targeting efficiency.
No direct dataset available for several niche metrics (specific regional Switzerland data, granular 2020-2021-2022 benchmarks by industry, exact AI negative impact rates). Modeled estimates based on adjacent data inputs and trend analysis where noted.
Research Compilation Date: January 15, 2026
Total Sources Analyzed: 109 industry reports, benchmarks, and studies<>Data Coverage: 2020-2025 historical, 2026-2030 forecast
Geographic Scope: Global with regional splits (North America, Europe, Asia-Pacific, Africa, Latin America)
Industry Coverage: Overall, B2B, B2B SaaS, Ecommerce, Nonprofit, and 15+ sectors
This report synthesizes verified data from Litmus, Campaign Monitor, Klaviyo, Omnisend, HubSpot, Statista, Validity, EmailToolTester, and 90+ additional authoritative sources to provide institutional-grade intelligence for email marketing strategy through 2030.
Verify 200 emails for free. For lists over one-million emails, we will beat the price of any competitor, guaranteed.