Email Bounce Rate Benchmarks 2025–2026: All You Need To Know
Email bounce rate used to be a quiet way to measure deliverability, but in 2025–2026 it’s a frontline deliverability metric. Knowing how your numbers compare to current benchmarks is one of the fastest ways to spot list problems before inbox providers do.
What Email Bounce Rate Really Tells You
Email bounce rate is the number of messages that don't get to a recipient’s inbox because the server rejects them. You can calculate it using this formula:
Bounce rate = ( Total bounces ÷ Total emails sent ) × 100
Unlike website bounce rate, which measures single‑page sessions, email bounce rate is a pure deliverability metric. It answers the question, "Did the mailbox provider accept the message at all?" instead of "Did people engage?"
That's why serious email performance reports include benchmarks for bounces along with open, click, and spam complaint rates.
Most benchmarks fall into one of two groups:
- Hard bounces: permanent failures, like addresses that don't exist, domains that aren't valid, or senders that are blocked.
- Soft bounces: problems that don't last long, like full inboxes, messages that are too big, greylisting, or the receiving server slowing down.
When you compare your program to industry standards, both numbers are important because most ESPs eventually treat repeated soft bounces as hard bounces.
Why Bounce Rate Matters More After Gmail and Yahoo Changes
Bounce rate has always been an important deliverability signal, but it went from "nice to watch" to "must monitor" when Gmail and Yahoo made their spam and authentication rules stricter in 2024–2025.
In Google’s postmaster documentation, senders are explicitly told to cut back on sending volume when bounce or deferral errors go up, and to focus on list quality before sending more.
High bounces do more than just waste sends. They:
- Hurt the reputation of the domain and IP, which makes it more likely that future campaigns will end up in spam or be put off.
- Make it more likely that you will hit spam traps and recycled addresses, which many providers use to find abusive senders.
- Hide bigger problems in your CRM/ESP sync, like bought lists, bad data capture, or broken workflows.
In real life, a campaign with a 4–5% bounce rate today isn't just "a bit sloppy"; it's a sign that big inboxes might start blocking or filtering your future mail.
What Counts as a “Good” Email Bounce Rate?
One surprisingly consistent thing that comes up in different benchmark studies is that less than 2% of marketing emails bouncing back is a healthy range, while more than 5% is considered critical. For example, a European benchmark report from 2025 puts the limits this way:
- Below 2%: normal and safe.
- 2–5%: warning level that calls for list hygiene and verification.
- Above 5%: critical level that can seriously damage sender reputation.
Listmint's 2025 report on website and email bounce rates also says that email bounce rates below 2% are "safe" in most industries. Tools like Mailtrap's deliverability guides say you should aim for about 0.5–2%, depending on how old your list is and how aggressively you get new subscribers.
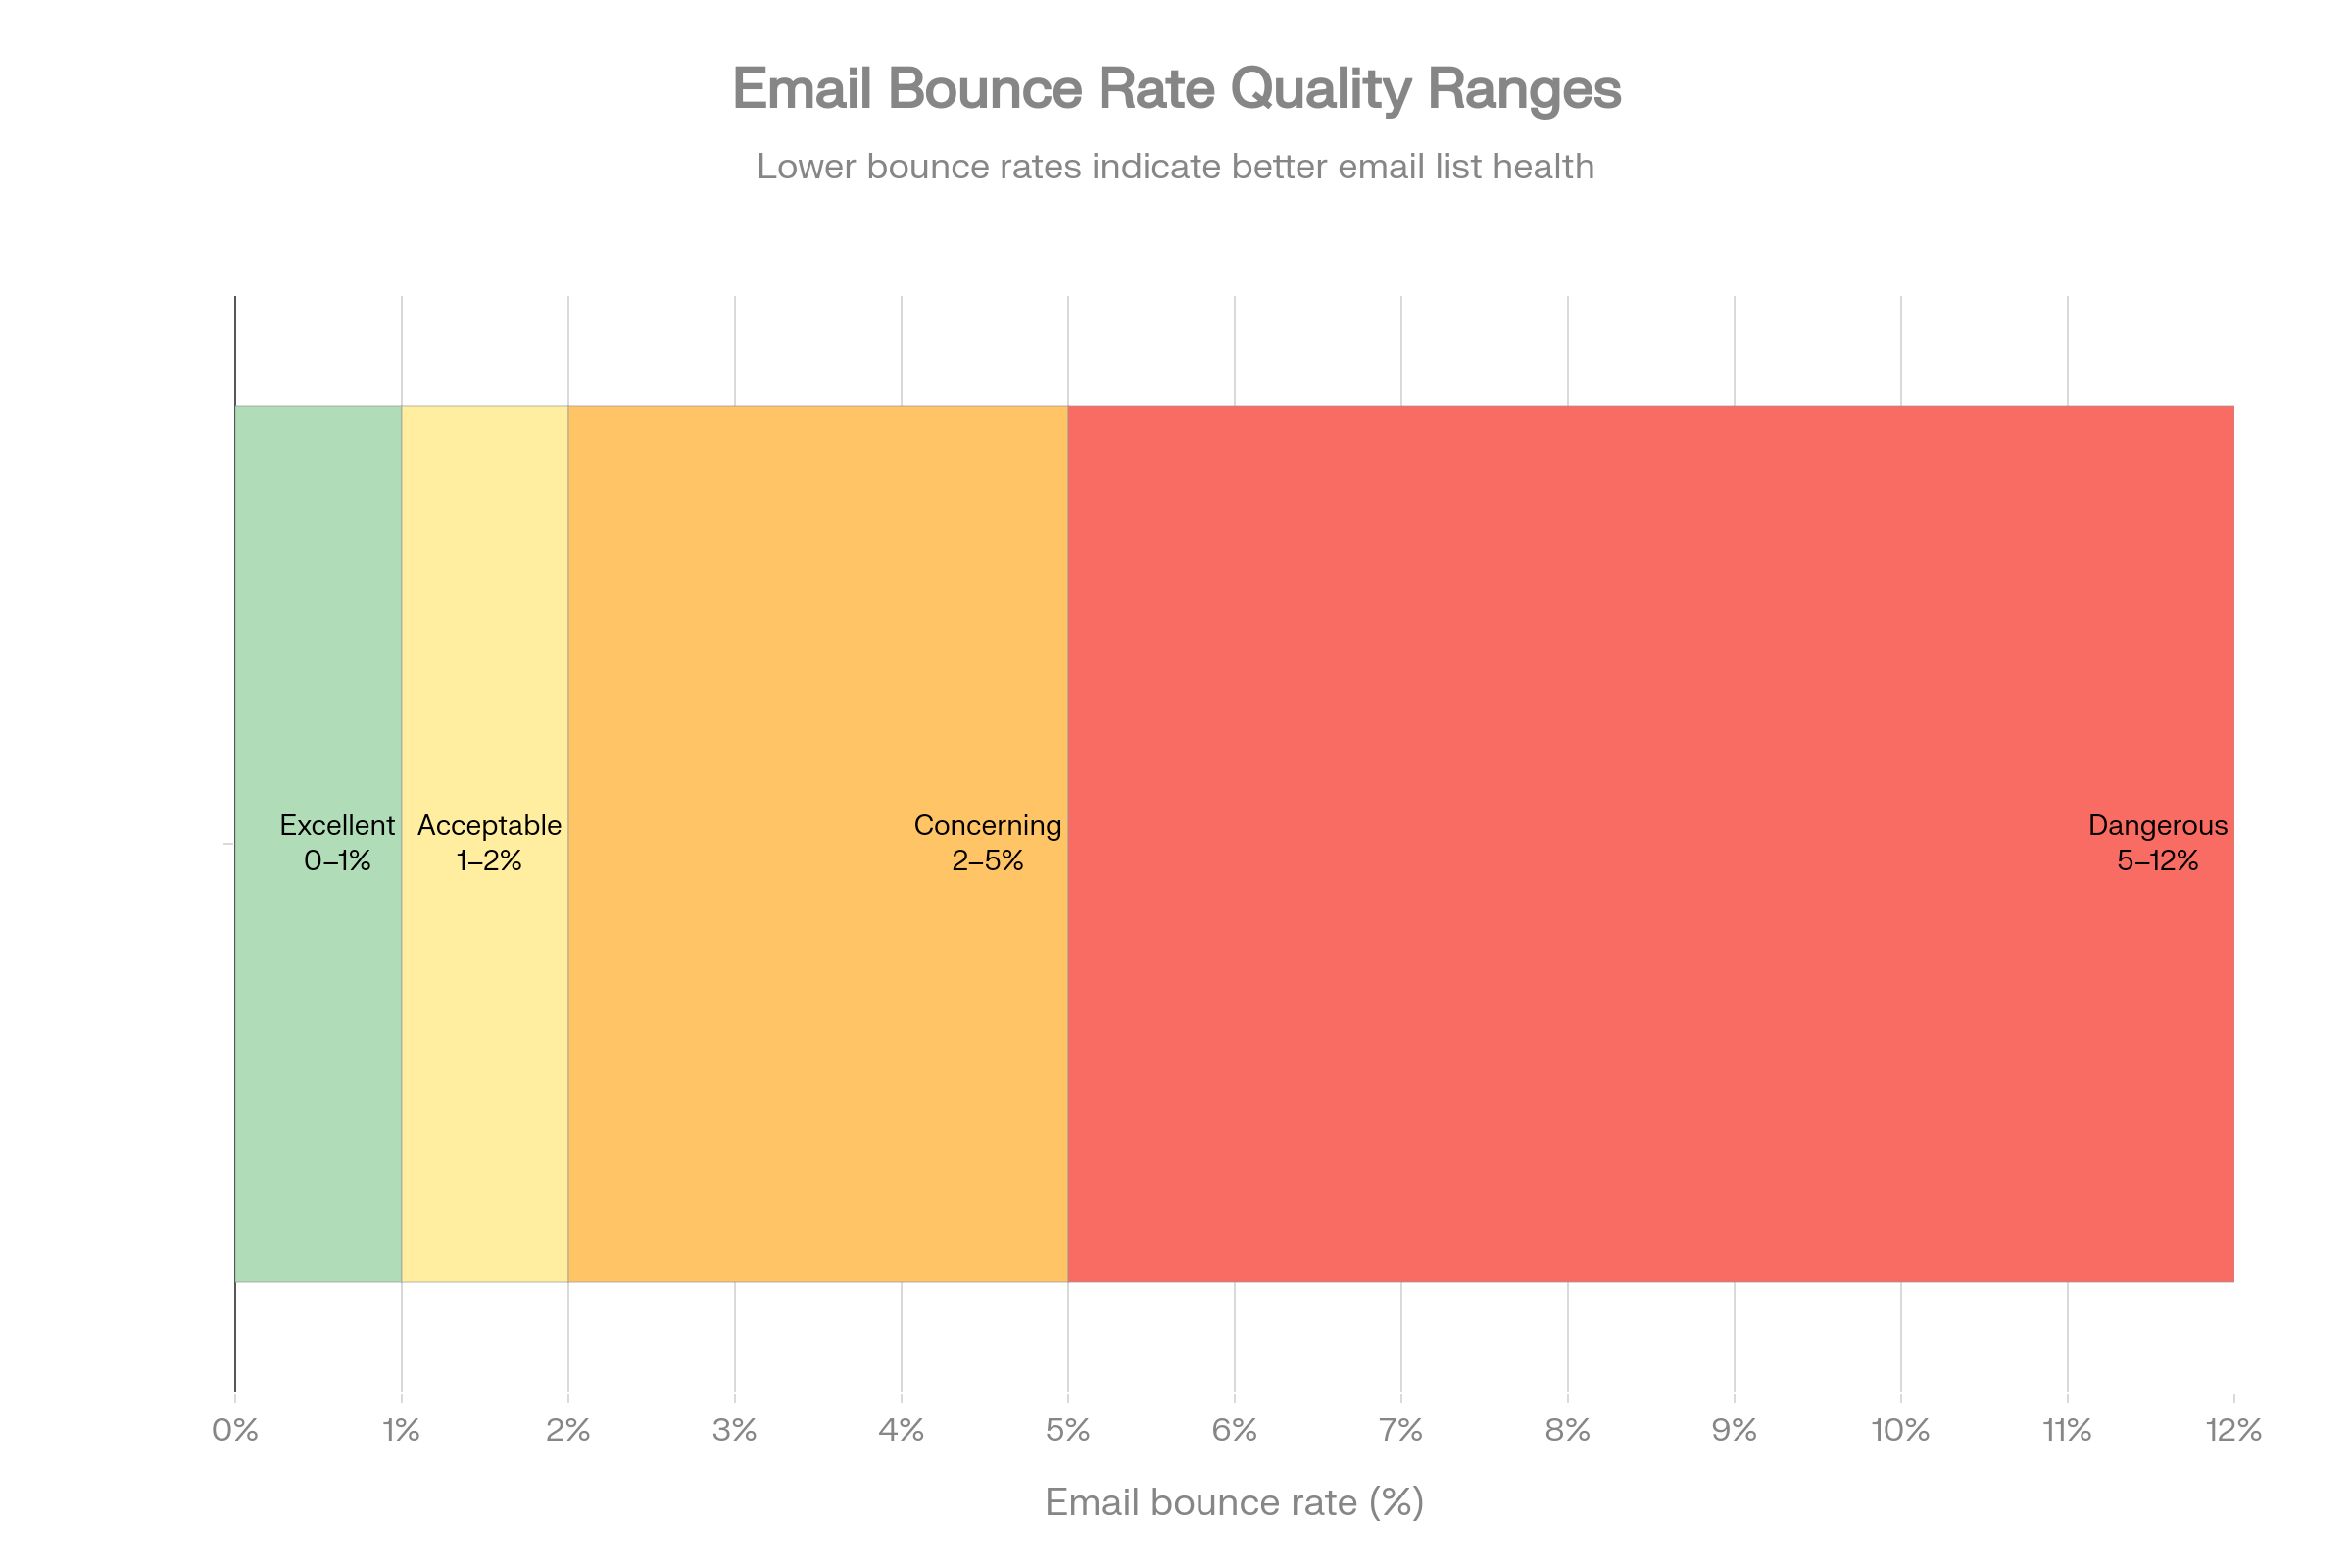
You can translate those ranges into a simple mental model:
- Excellent: < 1% total bounces.
- Acceptable: 1–2%.
- Concerning: 2–5%.
- Dangerous: > 5%.
Global Email Bounce Rate Benchmarks: Why Sources Disagree
The averages don't always match up perfectly when you start to compare different studies. That gap isn't noise; it shows how each study defines the term "average sender."
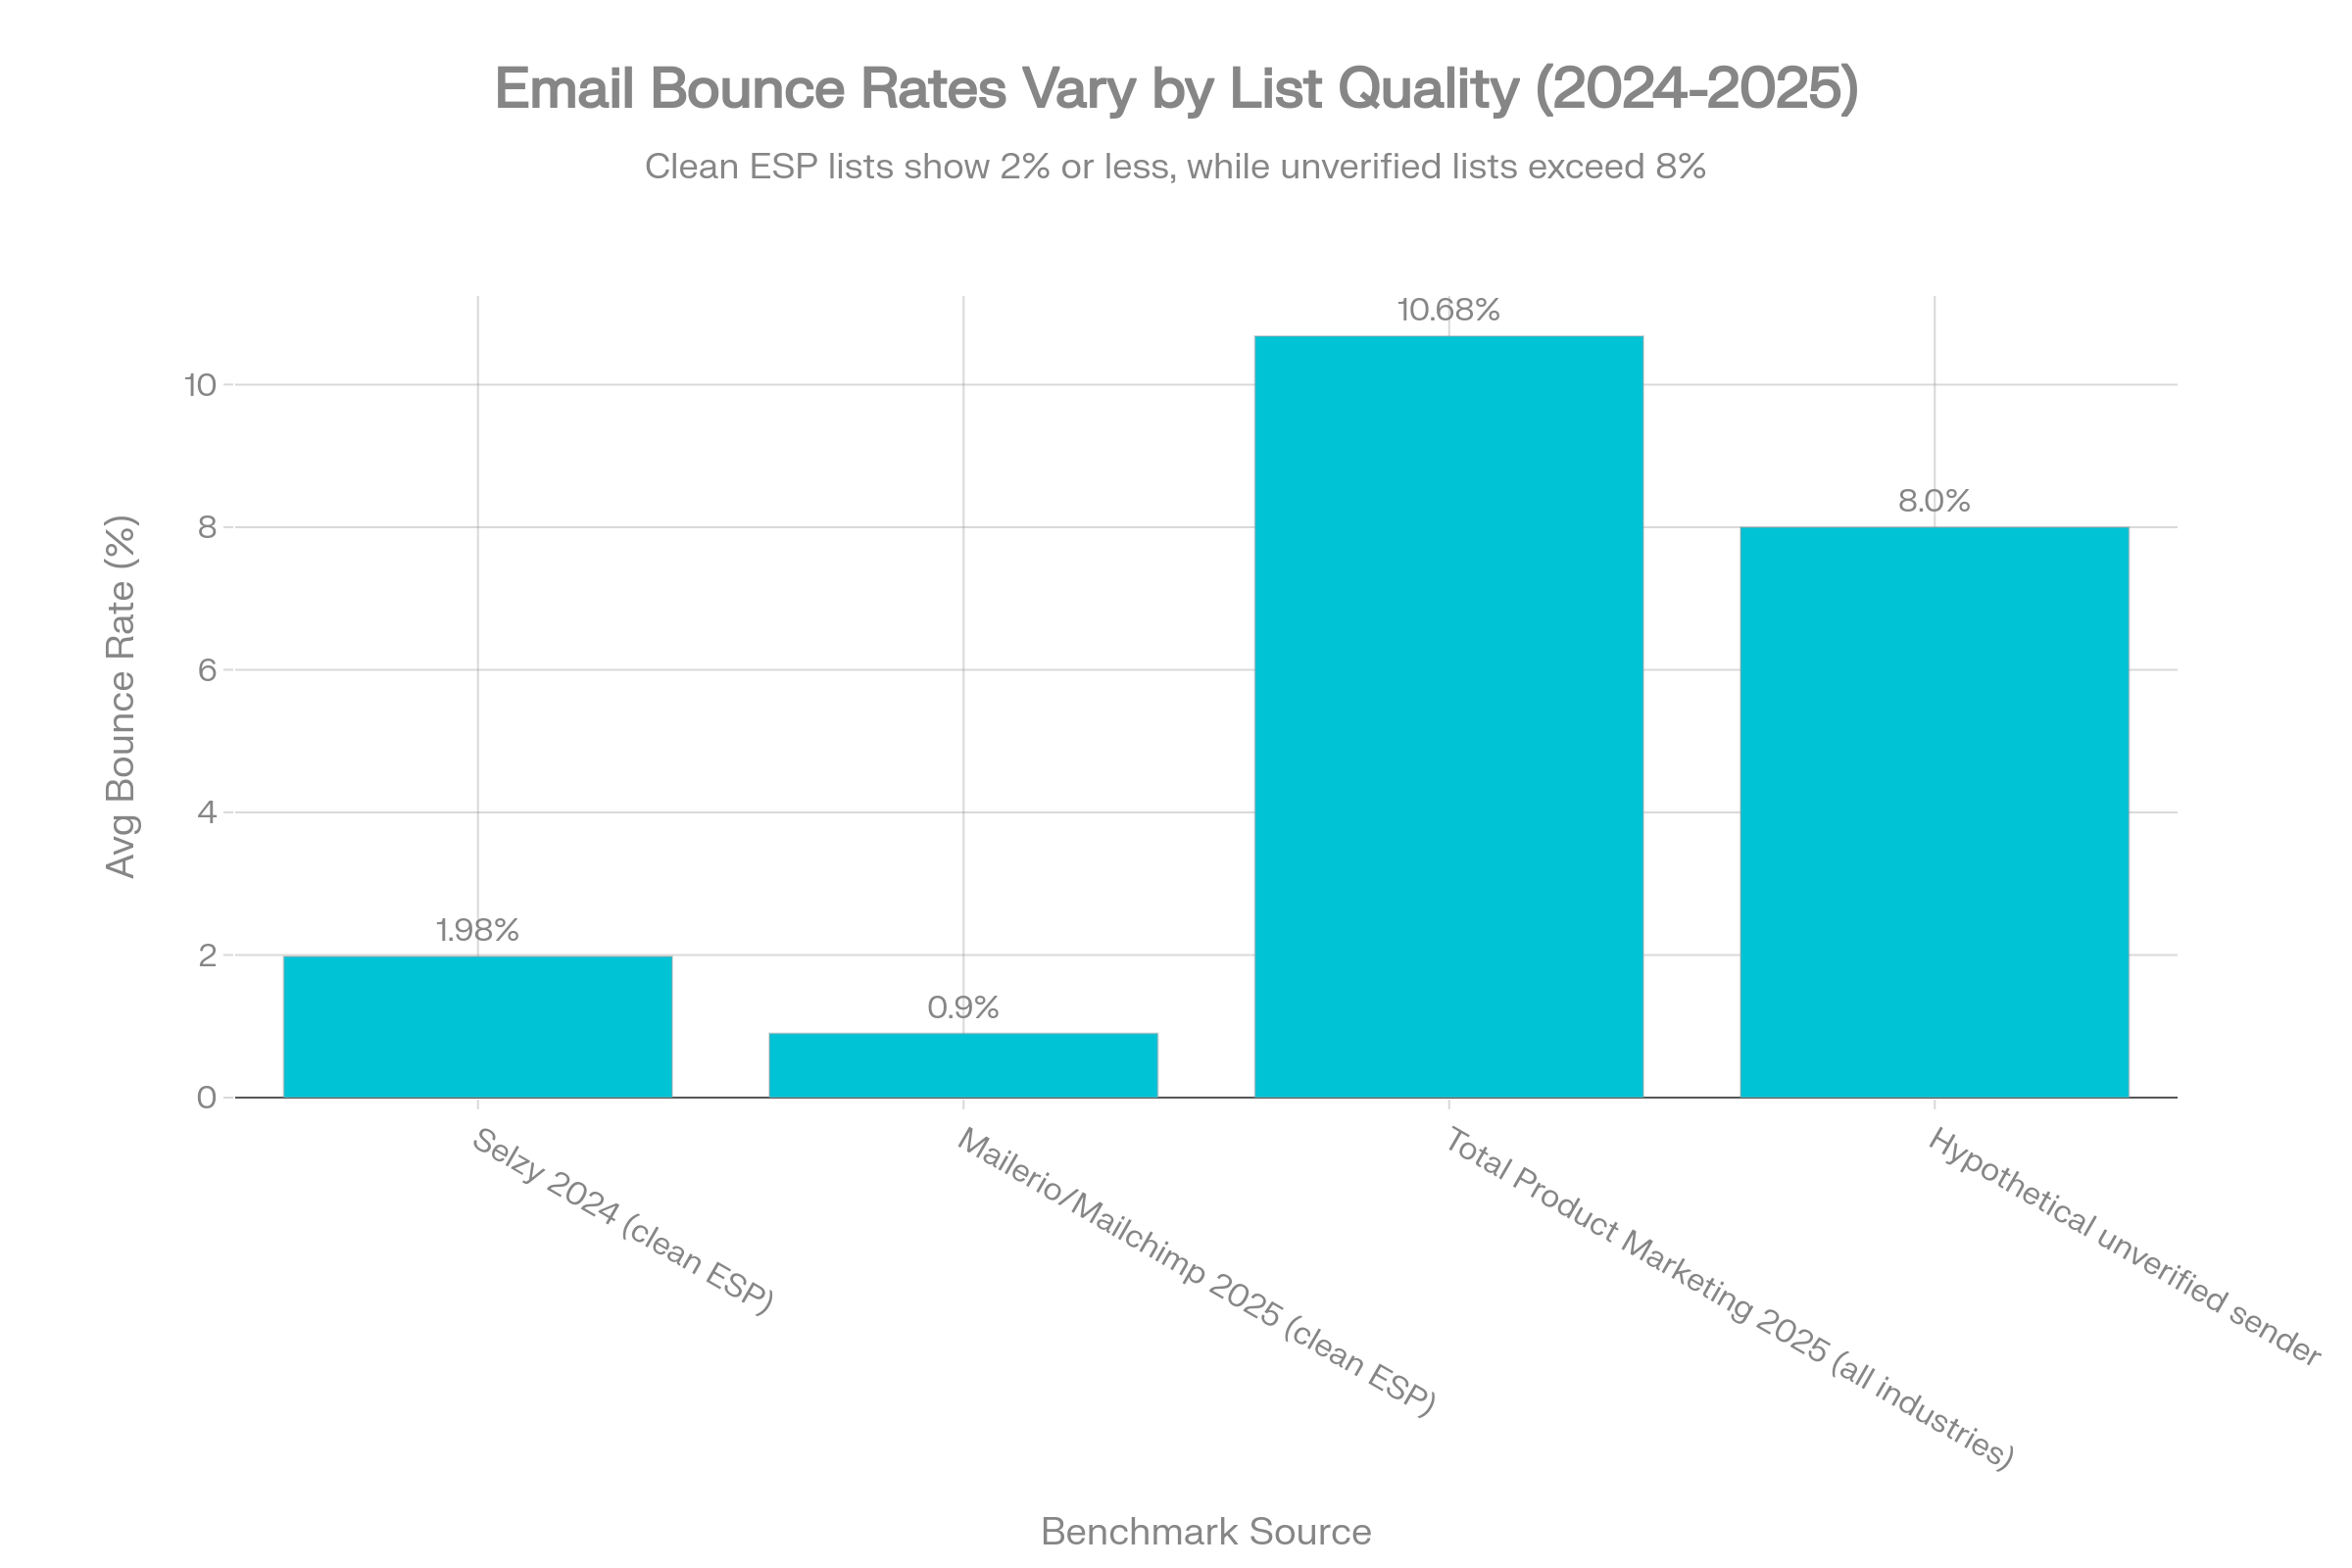
“Clean ESP” datasets: around 1–2%
Selzy's 2024 industry benchmark research, which looked at real marketing programs in a number of fields, found that the average bounce rate is 1.98%. Tourism, travel, and nonprofit sectors often have higher deliverability and lower bounce rates than marketing, ecommerce, and media sectors, which tend to be closer to that ceiling.
Mailerio's 2025 look at Mailchimp data shows even tighter numbers: the average hard bounce rate is 0.21% and the soft bounce rate is 0.70% across billions of emails. That adds up to about 0.9% of all bounces in this dataset.
These reports mostly show consent-based marketing lists in mature ESPs, where obvious abuse and fake addresses are quickly removed.
“All senders” view: double‑digit averages
When you look at a bigger sample, the picture changes. Total Product Marketing’s 2025 analysis, which looks at email marketing performance “in all industries," finds that the average bounce rate for emails was 10.68% as of January 2025. That number is about five times higher than Selzy's and more than ten times higher than Mailerio's average based on Mailchimp.
You can only see this kind of figure when you add:
- Cold outreach at scale.
- Legacy CRM lists that haven’t been cleaned in years.
- Purchased or scraped contact databases.
The real story behind the numbers
Methodology explains most of the divergence:
- Audience: ESP-centric reports are about marketing that is based on permission; broad reports are about cold outreach and old databases.
- Counting rules: Some benchmarks only count hard bounces, while others count both hard and soft bounces or treat repeated soft bounces as hard.
- Industry mix: Datasets that focus on fast-moving B2B sectors (like tech and professional services) tend to show more list decay than datasets that focus on consumers.
For practical benchmarking, think of it this way: if your bounce rate stays between 1% and 2%, you are in the "clean ESP" world. If it goes up to 10%, you are more like the average sender in the wider market, which is not a good place to be.
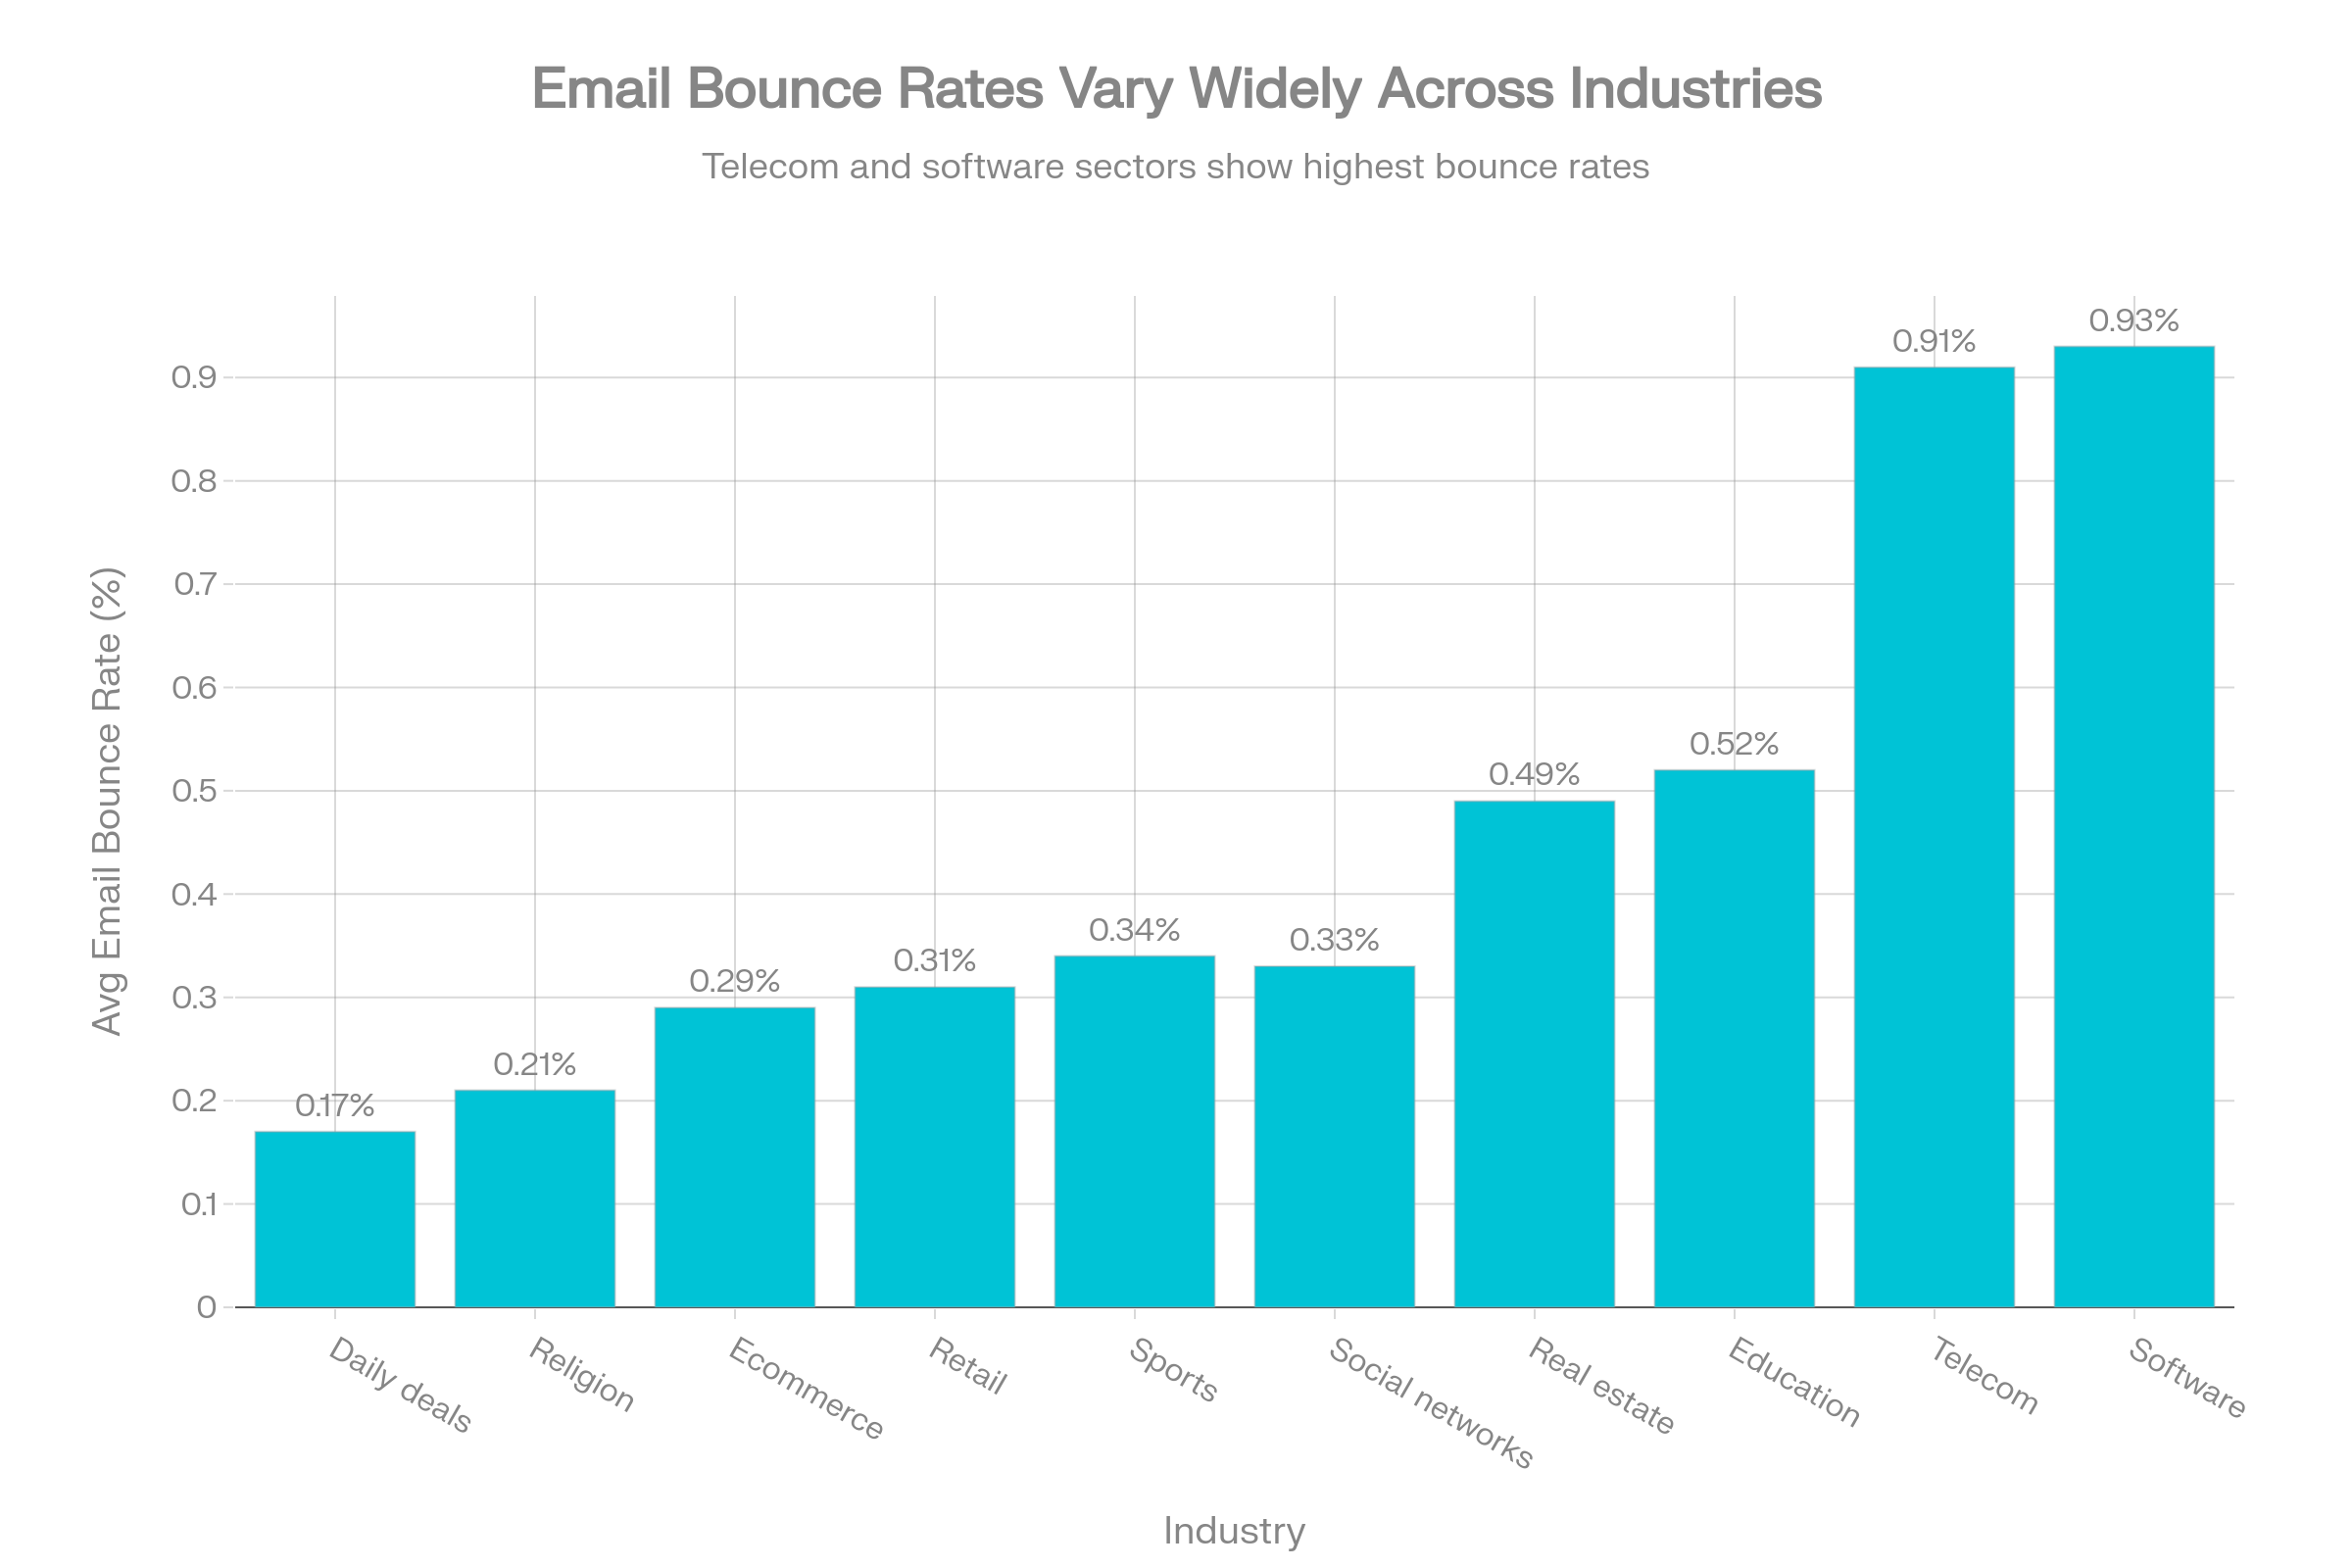
Email Bounce Rate Benchmarks by Industry (Mailchimp / Mailerio View)
Industry‑level benchmarks are where the data becomes actionable. Mailerio’s 2025 bounce‑rate analysis republishes Mailchimp’s latest soft, hard, and total bounce rates across more than 30 industries.
Here is a condensed version of that table:
| Industry | Soft bounce | Hard bounce | Average bounce rate |
|---|---|---|---|
| Daily deals / e‑coupons | 0.06% | 0.28% | 0.17% |
| Religion | 0.08% | 0.33% | 0.21% |
| Ecommerce | 0.12% | 0.45% | 0.29% |
| Retail | 0.14% | 0.48% | 0.31% |
| Sports | 0.15% | 0.52% | 0.34% |
| Social networks / communities | 0.15% | 0.51% | 0.33% |
| Real estate | 0.26% | 0.71% | 0.49% |
| Education and training | 0.23% | 0.80% | 0.52% |
| Telecommunications | 0.50% | 1.31% | 0.91% |
| Software and web app | 0.49% | 1.37% | 0.93% |
Several patterns stand out:
- Sectors with a lot of engagement, like ecommerce, retail, daily deals, and religion, have very low bounce rates, often less than 0.5% total. This is because subscribers sign up close to a transaction or community activity.
- Software, telecoms, and professional services are at the top of the list for B2B and infrastructure-driven sectors. Their total bounce rates are around 1% or less.
- The dataset shows that software and web apps have the highest average bounce rate. This is because they use aggressive acquisition and lists that decay quickly.
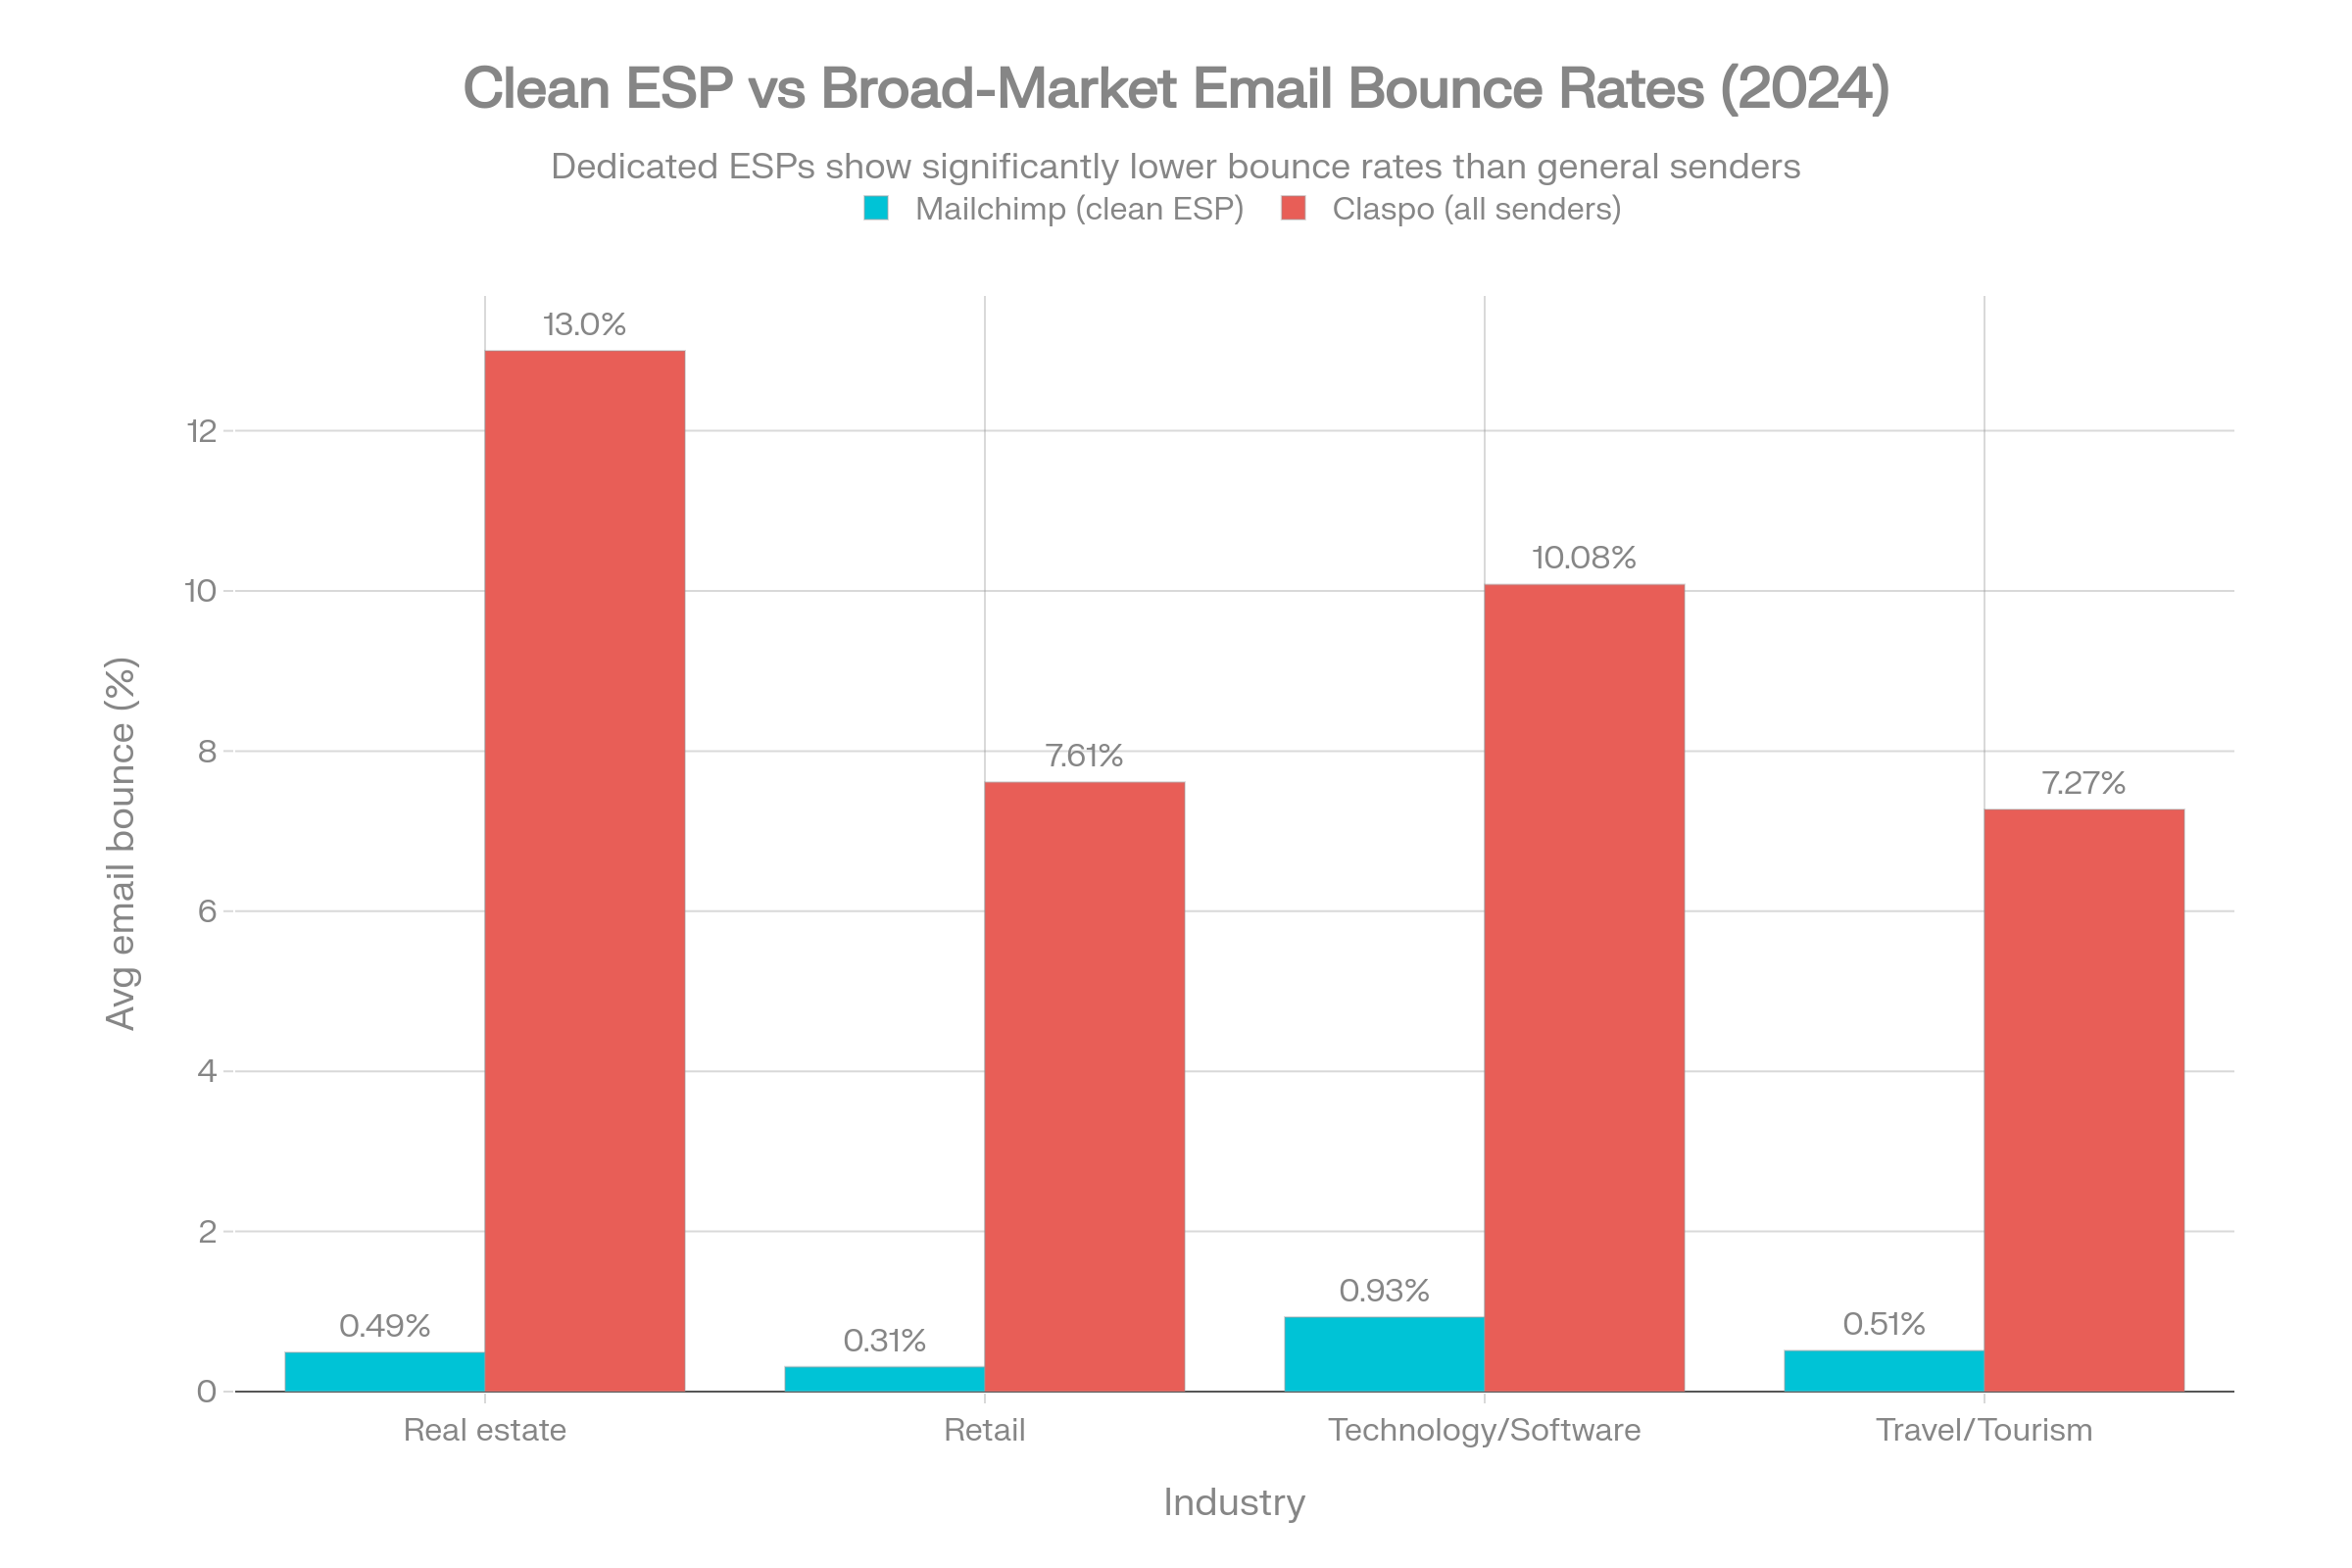
A “Messier” Reality Check: Claspo’s Industry Averages
To balance the clean Mailchimp view, look at Claspo’s 2025 study on average email bounce rates by industry, which includes a wider mix of senders. Their numbers are dramatically higher:
| Industry | Average email bounce rate |
|---|---|
| Legal services | 15.69% |
| Manufacturing and distribution | 14.83% |
| Real estate | 13.00% |
| Personal care | 11.38% |
| Administrative and business support | 11.16% |
| Health and wellness | 10.12% |
| Technology | 10.08% |
| Financial services | 9.58% |
| Retail | 7.61% |
| Travel and tourism | 7.27% |
Claspo explicitly says that bounce rates are "worrying across all industries" and gives several possible reasons for this: old contact databases, inconsistent consent collection, and not keeping up with list maintenance.
When you put this next to the Mailchimp/Mailerio table, you get a strong story:
- The numbers from Mailchimp show what can happen when you use a modern ESP and keep your lists clean.
- Claspo's numbers show what happens when you include everyone, even senders who don't often check or clean their lists.
Hard vs Soft Bounce Benchmarks
Most quick benchmark posts don't make it clear which are hard and which are soft bounces, but they act differently and should have different goals.
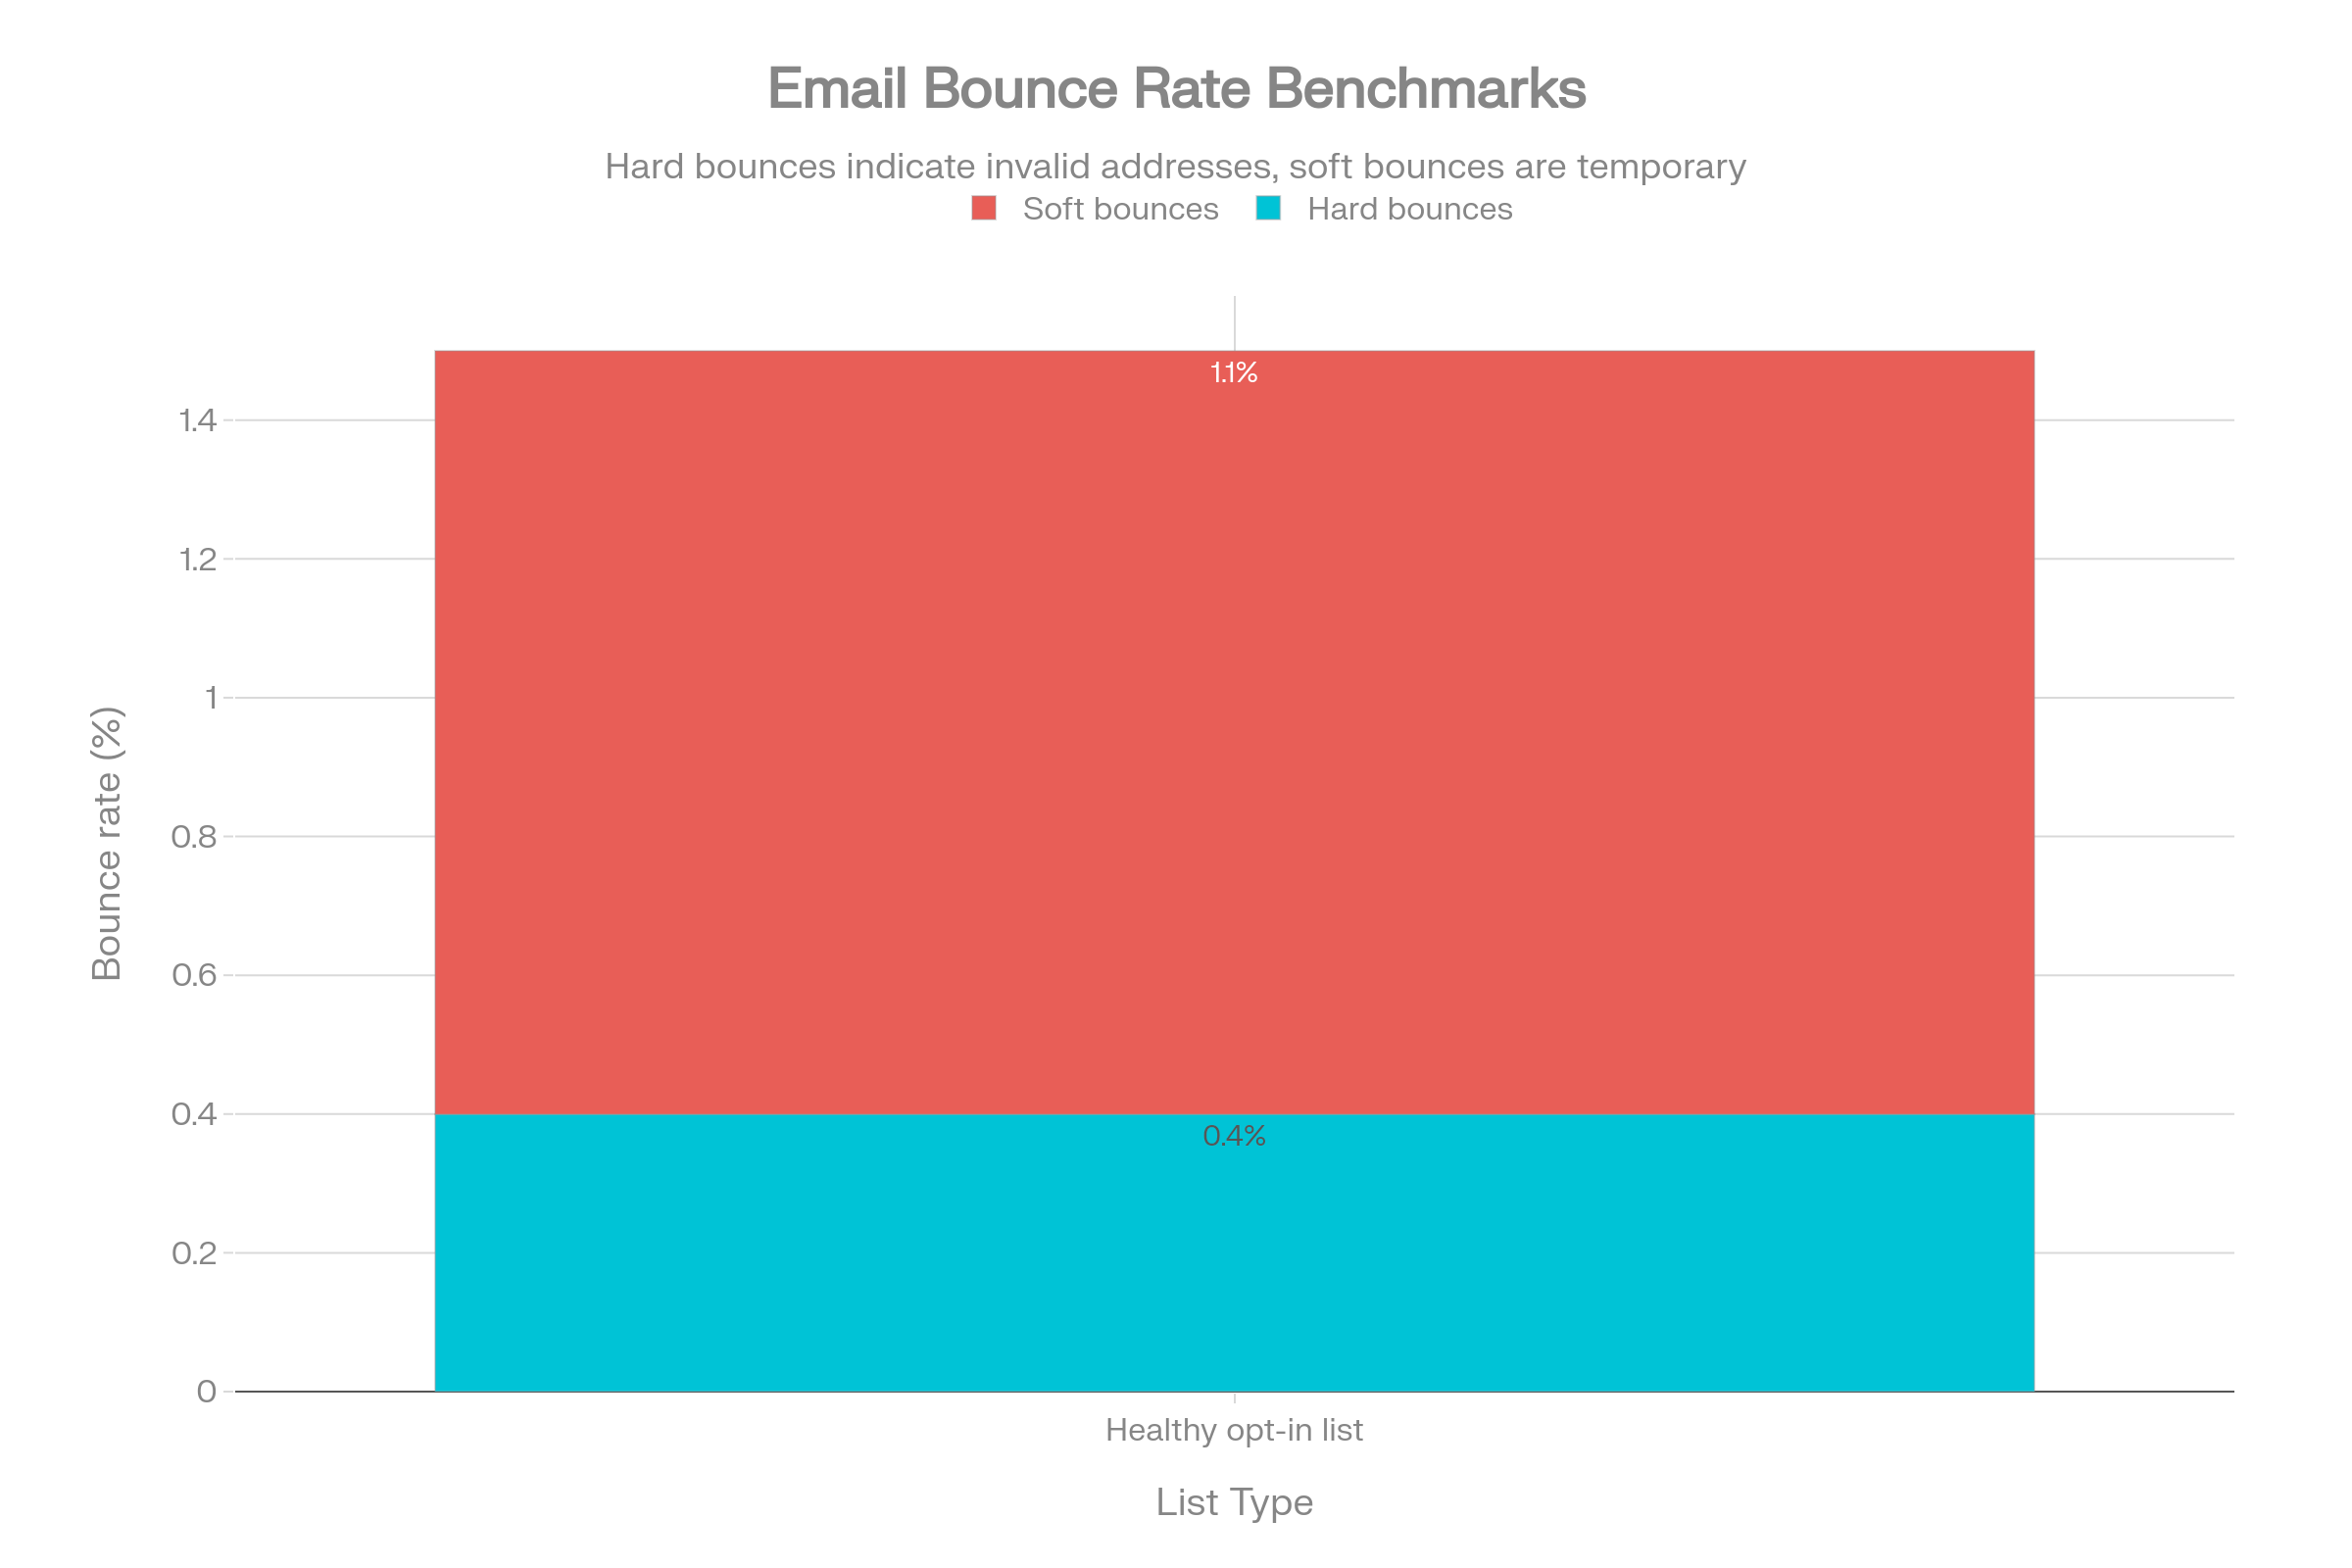
Across all industries, Mailerio's Mailchimp-based data shows an average hard bounce rate of 0.21% and a soft bounce rate of 0.70%. According to Mailtrap's 2025 guide, hard bounces should stay below 0.5% in healthy, permission-based lists. Soft bounces change more based on how you send them, the infrastructure, and how the recipient's server behaves.
Mailreach's in-depth look at hard vs. soft bounces shows that soft bounces are often caused by temporary server problems, mailbox limits, or throttling. They can be fixed by warming up domains, changing send speeds, and tightening technical setups. Hard bounces are mostly a problem with the quality of the list, and they are strongly linked to addresses that are not valid or don't exist.
For practical reasons, aim for:
- Hard bounces: less than 0.3–0.5% in opt-in lists.
- Soft bounces: less than 1–1.5% when sending steadily.
- Total bounces: should be less than 2% whenever possible.
Why Some Industries Bounce Much More Than Others
Mailerio’s article includes a candid commentary from its founder on why SaaS and web app companies often top the bounce‑rate charts. That explanation also helps to shed light on trends in other high-risk groups.
Some common drivers include:
- High lead volume but uneven lead quality from demos, trials, and gated content that allow disposable or fake email addresses.
- Rapid job changes in tech and professional services that make work addresses useless.
- A tendency to skip double opt‑in to get more short‑term growth, letting typos and low‑intent signups slip in.
- Heavy reliance on cold outreach tools and scraped lists that rarely pass through proper verification.
- Fast scaling from fresh domains and IPs without enough warmup, triggering temporary rejections and soft bounces.
Claspo's data shows that legal services, manufacturing, administrative support, and real estate all have similar problems. These are all areas that often rely on big, old databases that were put together from many sources over many years.
For these fields, just "sending less" isn't enough. To get anywhere near the Mailchimp-level benchmarks, they need to make structural changes like making verification flows mandatory and making list management rules stricter.
How to Benchmark Your Own Email Bounce Rate
You can only use all of this research to make decisions about your own program if you can turn it into action. This is what a simple benchmarking process looks like:
- Find out what your current bounce rate is. Use the same formula for a number of campaigns so that one strange send doesn't change your view.
- Separate hard and soft bounces. Most ESPs show these in separate sections. Hard bounces show the quality of the data, while soft bounces show problems with the infrastructure, sending patterns, and limits on the recipient's side.
- Segment by list and source. Look at bounce rates by where they came from (website forms, lead magnets, events, CRM imports, cold outreach). You will usually see that older imports and cold lists get a lot more hard bounces than new, verified signups.
- Check against global limits:
- Less than 1%: you're doing better than a lot of modern marketing programs.
- 1–2%: You're in the "acceptable" range, but you could do better.
- 2–5%: You are in the warning zone that the major benchmark reports talk about.
- If you go above 5%, you're close to the double-digit averages found in broad industry studies and are in serious danger of damaging your reputation.
- Check against industry tables.
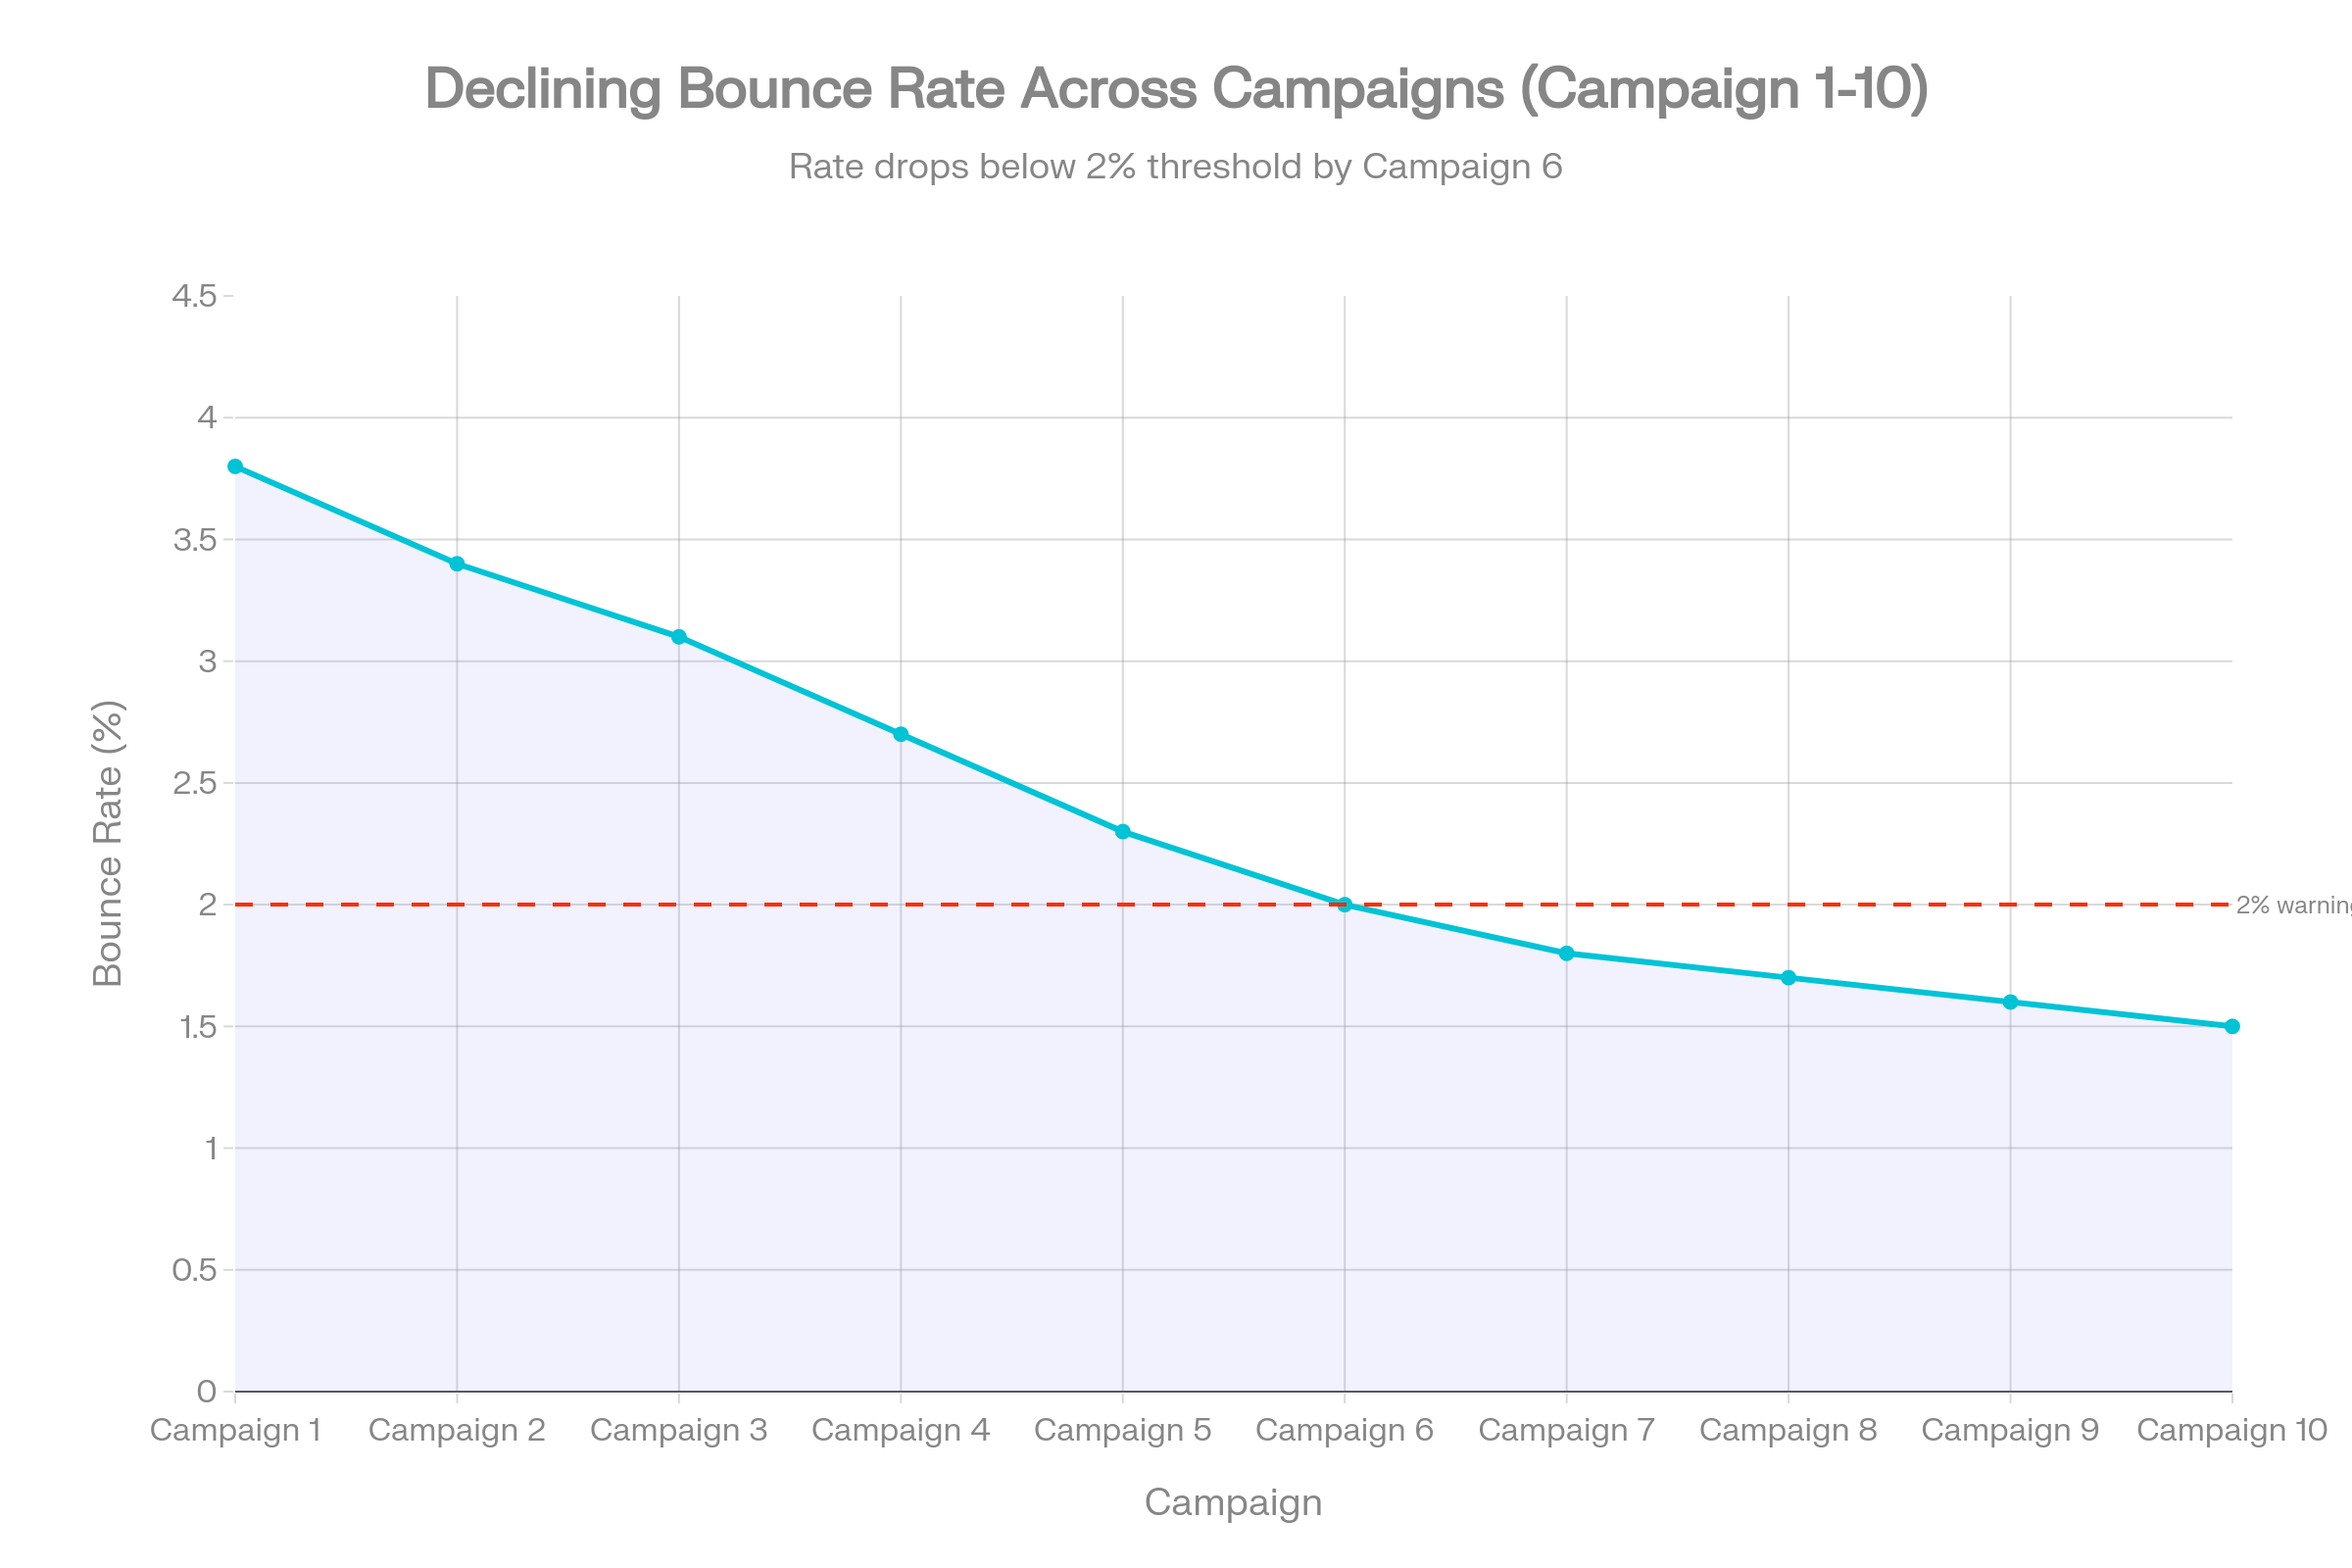
A simple line chart of your bounce rate over the last 6–12 sends, with a horizontal line at 2%, is often enough to show whether things are improving, stagnating, or trending into danger.
How Email Verification Fits Into the Picture
Email verification is the most powerful tool you have once you know what your bounce rate is. Verification tools sit between your raw data and the inbox, catching invalid, risky, and old addresses before they ever bounce.
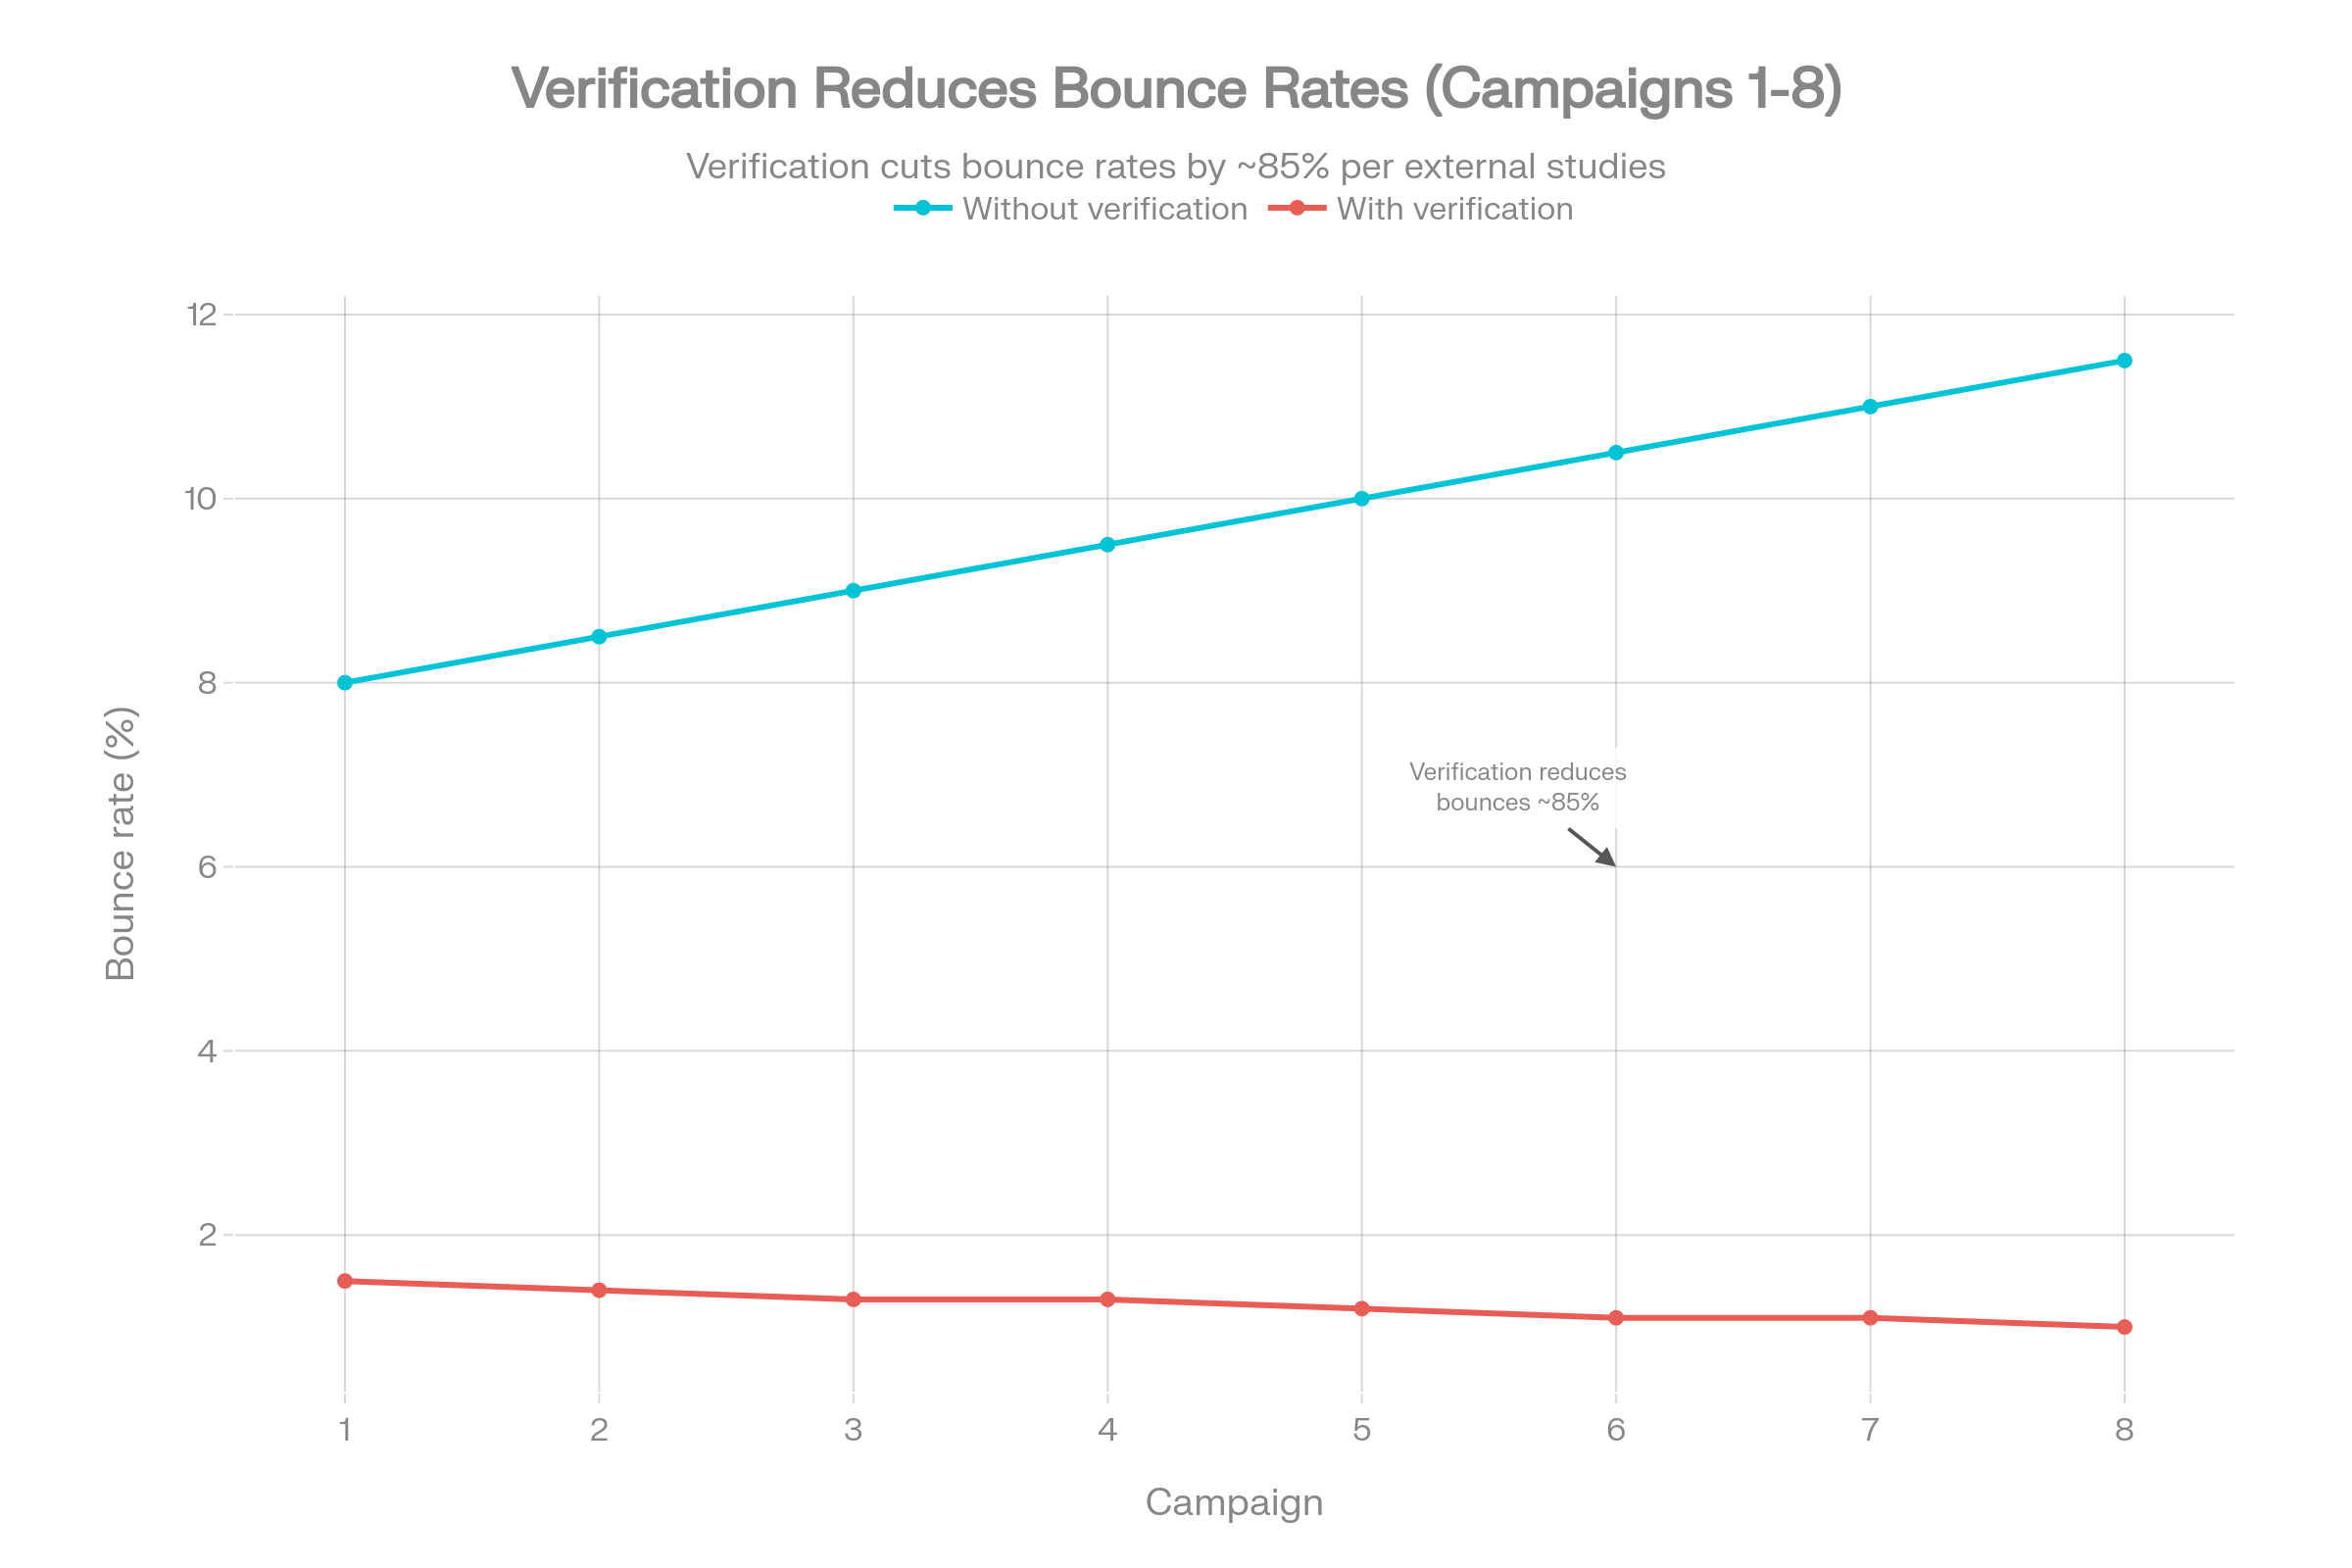
Research on big datasets of cold emails shows that campaigns that verify before sending can lower bounce rates by more than 80% and greatly increase response and inbox placement rates. Verification doesn't just make reports look better; it also affects how many of your messages actually get to real people.
The difference between verified and unverified sending becomes even clearer over multiple campaigns.
This is where a service like VerifiedEmail comes in. You can do the following by adding verification to your forms, CRMs, and import workflows:
- Validate new addresses in real time at the point of capture.
- Regularly clean older segments and high-risk lists before big sends.
- Even as you grow, make sure that hard bounces stay below the 2% "safe" level.
For industries with a lot of data and a lot of churn, like SaaS, legal, manufacturing, and real estate, adding a verification layer like VerifiedEmail between your raw data sources and your ESP is often the only way to keep bounce rates low over time.
Practical Ways to Lower Your Bounce Rate
With benchmarks and verification in mind, there are several concrete steps to take:
- Add real-time verification at capture
Adding verification checks to signup forms, checkout flows, and lead-gen pages keeps fake and temporary emails from getting through.
- Run scheduled cleaning of bulk lists
For databases that already exist, especially those that get data from ads, events, or imports, set up regular checks (like once every three months) to get rid of addresses that have become less accurate since you got them.
- Use double opt-in for important lists
Double opt-in makes things a little harder, but it greatly improves the quality of the list and cuts down on typos and bots, which later show up as hard bounces.
- Take your time warming up new domains and IPs
When you send from a new domain or IP, start with smaller, more engaged segments and slowly increase the volume to build trust and avoid soft bounces caused by throttling.
- Adjust send frequency and prune dead weight
Sending too many emails to people who aren't interested makes them complain more and can make soft bounces worse. Not sending enough emails makes lists out of date. Get rid of people who haven't been active in a long time and keep a steady pace.
- Keep your infrastructure and authentication tight
Setting up SPF, DKIM, and DMARC correctly, making sure that sending domains are aligned, and having clean reverse DNS records all lower the risk of policy-driven rejections.
When you use a verification platform like VerifiedEmail along with these practices, you're not just trying to get a better metric. You're changing the data itself so that inbox providers have fewer reasons to reject or distrust your messages.
Related reading:
Verify 200 emails for free. For lists over one-million emails, we will beat the price of any competitor, guaranteed.